Breastfeeding withheld
Full analysis
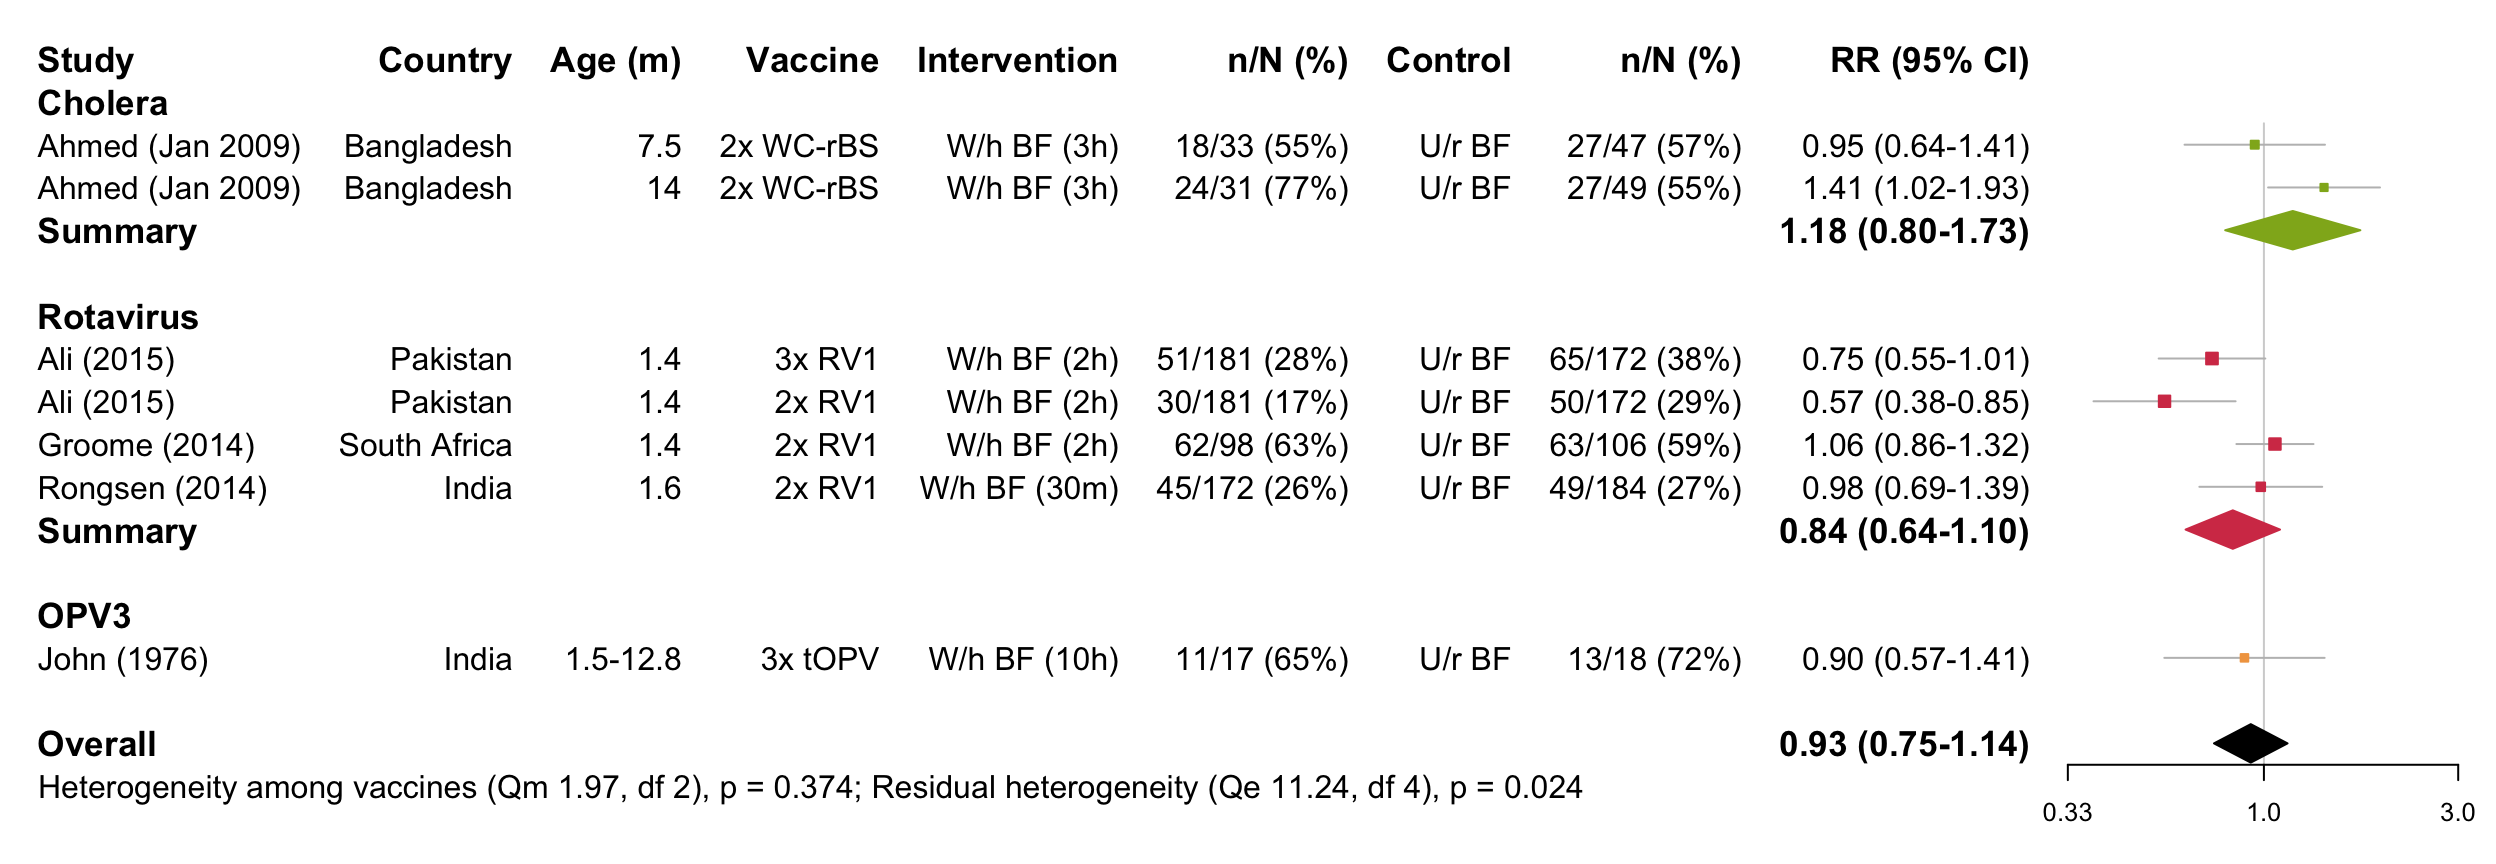
Forest plot
Funnel plot

Egger’s test
## [1] "No replication of infants across vaccines or significant vaccine effect, therefore combined test performed"##
## Regression Test for Funnel Plot Asymmetry
##
## model: mixed-effects meta-regression model
## predictor: standard error
##
## test for funnel plot asymmetry: z = -0.9152, p = 0.3601Meta-analysis output
##
## Random-Effects Model (k = 7; tau^2 estimator: REML)
##
##   logLik  deviance       AIC       BIC      AICc
##  -0.9362    1.8723    5.8723    5.4558    9.8723
##
## tau^2 (estimated amount of total heterogeneity): 0.0481 (SE = 0.0452)
## tau (square root of estimated tau^2 value):      0.2192
## I^2 (total heterogeneity / total variability):   63.04%
## H^2 (total variability / sampling variability):  2.71
##
## Test for Heterogeneity:
## Q(df = 6) = 15.7046, p-val = 0.0154
##
## Model Results:
##
## estimate      se     zval    pval    ci.lb   ci.ub
##  -0.0743  0.1061  -0.7002  0.4838  -0.2824  0.1337
##
## ---
## Signif. codes:  0 '***' 0.001 '**' 0.01 '*' 0.05 '.' 0.1 ' ' 1
Meta-regression output
##
## Mixed-Effects Model (k = 7; tau^2 estimator: REML)
##
## tau^2 (estimated amount of residual heterogeneity):     0.0473 (SE = 0.0529)
## tau (square root of estimated tau^2 value):             0.2176
## I^2 (residual heterogeneity / unaccounted variability): 64.46%
## H^2 (unaccounted variability / sampling variability):   2.81
## R^2 (amount of heterogeneity accounted for):            1.50%
##
## Test for Residual Heterogeneity:
## QE(df = 4) = 11.2386, p-val = 0.0240
##
## Test of Moderators (coefficient(s) 2:3):
## QM(df = 2) = 1.9685, p-val = 0.3737
##
## Model Results:
##
##                   estimate      se     zval    pval    ci.lb   ci.ub
## intrcpt             0.1623  0.2002   0.8104  0.4177  -0.2302  0.5547
## VaccinePolio       -0.2722  0.3753  -0.7251  0.4684  -1.0078  0.4635
## VaccineRotavirus   -0.3377  0.2416  -1.3979  0.1621  -0.8112  0.1358
##
## ---
## Signif. codes:  0 '***' 0.001 '**' 0.01 '*' 0.05 '.' 0.1 ' ' 1
Intervention-specific outputs
Summary of cholera studies
##
## Random-Effects Model (k = 2; tau^2 estimator: REML)
##
##   logLik  deviance       AIC       BIC      AICc
##  -0.1356    0.2711    4.2711    0.2711   16.2711
##
## tau^2 (estimated amount of total heterogeneity): 0.0433 (SE = 0.1086)
## tau (square root of estimated tau^2 value):      0.2080
## I^2 (total heterogeneity / total variability):   56.34%
## H^2 (total variability / sampling variability):  2.29
##
## Test for Heterogeneity:
## Q(df = 1) = 2.2903, p-val = 0.1302
##
## Model Results:
##
## estimate      se    zval    pval    ci.lb   ci.ub
##   0.1632  0.1950  0.8370  0.4026  -0.2190  0.5454
##
## ---
## Signif. codes:  0 '***' 0.001 '**' 0.01 '*' 0.05 '.' 0.1 ' ' 1
Summary of rotavirus studies
##
## Random-Effects Model (k = 4; tau^2 estimator: REML)
##
##   logLik  deviance       AIC       BIC      AICc
##  -0.4202    0.8405    4.8405    3.0377   16.8405
##
## tau^2 (estimated amount of total heterogeneity): 0.0485 (SE = 0.0607)
## tau (square root of estimated tau^2 value):      0.2202
## I^2 (total heterogeneity / total variability):   66.62%
## H^2 (total variability / sampling variability):  3.00
##
## Test for Heterogeneity:
## Q(df = 3) = 8.9483, p-val = 0.0300
##
## Model Results:
##
## estimate      se     zval    pval    ci.lb   ci.ub
##  -0.1759  0.1363  -1.2907  0.1968  -0.4430  0.0912
##
## ---
## Signif. codes:  0 '***' 0.001 '**' 0.01 '*' 0.05 '.' 0.1 ' ' 1
Summary of PV3 studies
## [1] "Insufficient studies (n<2)"Meta-regression: secondary moderators
Age group
##
##   infant multiple
##        6        1
##
## Mixed-Effects Model (k = 7; tau^2 estimator: REML)
##
## tau^2 (estimated amount of residual heterogeneity): 0.0605 (SE = 0.0560)
## tau (square root of estimated tau^2 value): 0.2461
## I^2 (residual heterogeneity / unaccounted variability): 69.93%
## H^2 (unaccounted variability / sampling variability): 3.33
## R^2 (amount of heterogeneity accounted for): 0.00%
##
## Test for Residual Heterogeneity:
## QE(df = 5) = 15.6182, p-val = 0.0080
##
## Test of Moderators (coefficient(s) 2):
## QM(df = 1) = 0.0110, p-val = 0.9164
##
## Model Results:
##
## estimate se zval pval ci.lb
## intrcpt -0.0722 0.1216 -0.5940 0.5525 -0.3106
## factor(Age_group)multiple -0.0377 0.3589 -0.1049 0.9164 -0.7410
## ci.ub
## intrcpt 0.1661
## factor(Age_group)multiple 0.6657
##
## ---
## Signif. codes: 0 '***' 0.001 '**' 0.01 '*' 0.05 '.' 0.1 ' ' 1Income setting
##
##  low_lowermiddle uppermiddle_high
##                6                1
##
## Mixed-Effects Model (k = 7; tau^2 estimator: REML)
##
## tau^2 (estimated amount of residual heterogeneity): 0.0612 (SE = 0.0608)
## tau (square root of estimated tau^2 value): 0.2473
## I^2 (residual heterogeneity / unaccounted variability): 64.30%
## H^2 (unaccounted variability / sampling variability): 2.80
## R^2 (amount of heterogeneity accounted for): 0.00%
##
## Test for Residual Heterogeneity:
## QE(df = 5) = 14.3643, p-val = 0.0135
##
## Test of Moderators (coefficient(s) 2):
## QM(df = 1) = 0.3207, p-val = 0.5712
##
## Model Results:
##
## estimate se zval pval
## intrcpt -0.1070 0.1267 -0.8446 0.3983
## factor(Income_group)uppermiddle_high 0.1695 0.2993 0.5663 0.5712
## ci.lb ci.ub
## intrcpt -0.3554 0.1413
## factor(Income_group)uppermiddle_high -0.4172 0.7562
##
## ---
## Signif. codes: 0 '***' 0.001 '**' 0.01 '*' 0.05 '.' 0.1 ' ' 1Background immunogenicity (seroconversion rate in the control group)
##
## Mixed-Effects Model (k = 7; tau^2 estimator: REML)
##
## tau^2 (estimated amount of residual heterogeneity):     0.0369 (SE = 0.0420)
## tau (square root of estimated tau^2 value):             0.1921
## I^2 (residual heterogeneity / unaccounted variability): 56.56%
## H^2 (unaccounted variability / sampling variability):   2.30
## R^2 (amount of heterogeneity accounted for):            23.23%
##
## Test for Residual Heterogeneity:
## QE(df = 5) = 11.1609, p-val = 0.0483
##
## Test of Moderators (coefficient(s) 2):
## QM(df = 1) = 1.7566, p-val = 0.1850
##
## Model Results:
##
##                                      estimate      se     zval    pval
## intrcpt                               -0.7068  0.4892  -1.4448  0.1485
## asin(sqrt(Baseline_seroconversion))    0.8301  0.6263   1.3254  0.1850
##                                        ci.lb   ci.ub
## intrcpt                              -1.6657  0.2521
## asin(sqrt(Baseline_seroconversion))  -0.3974  2.0576
##
## ---
## Signif. codes:  0 '***' 0.001 '**' 0.01 '*' 0.05 '.' 0.1 ' ' 1
OPV-specific analysis
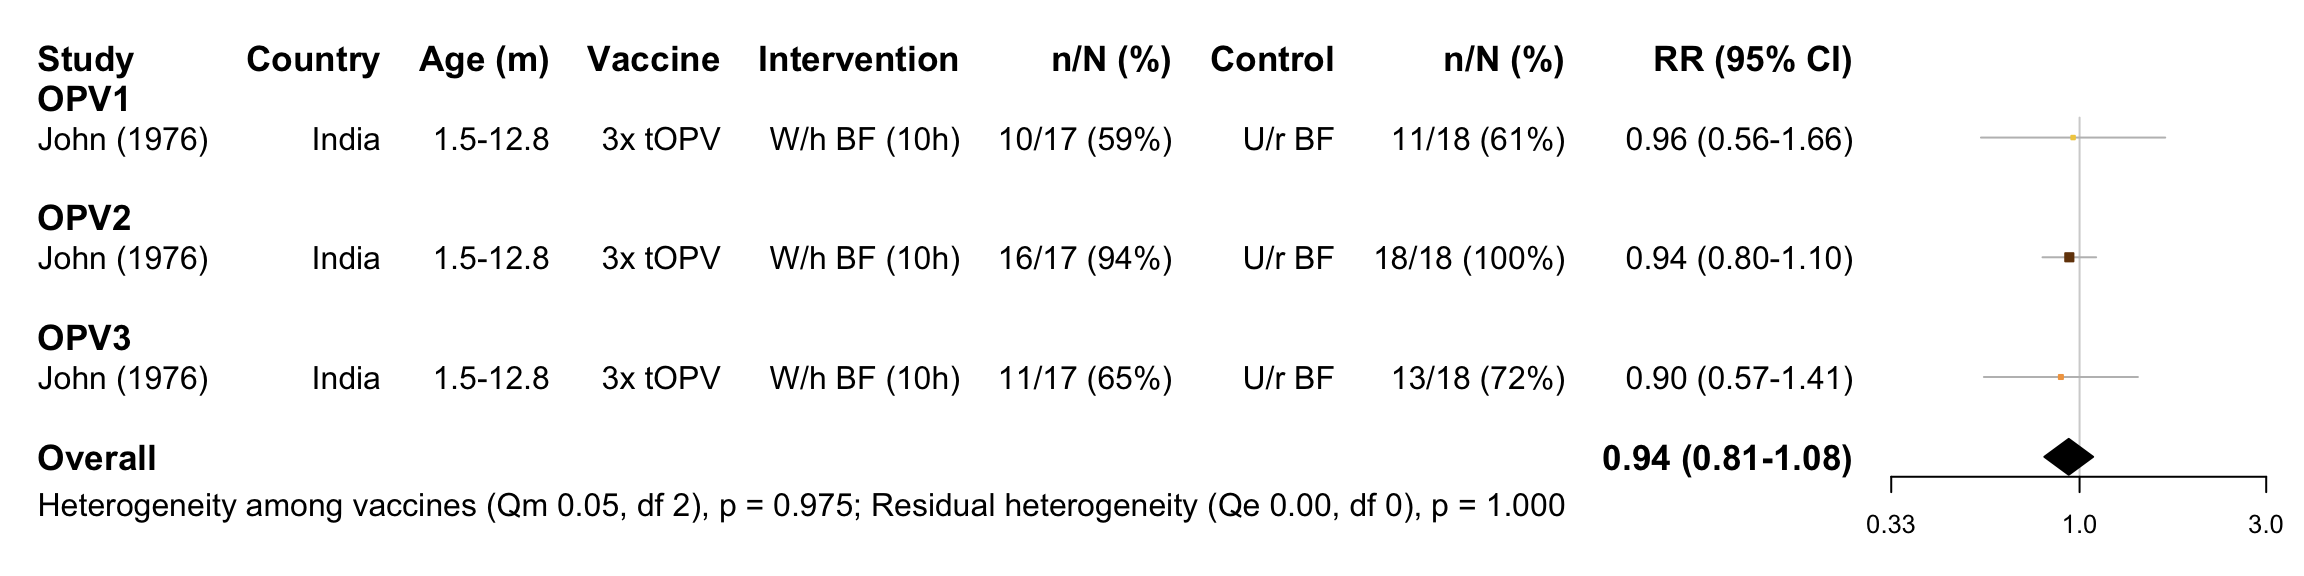
Forest plot
Funnel plot
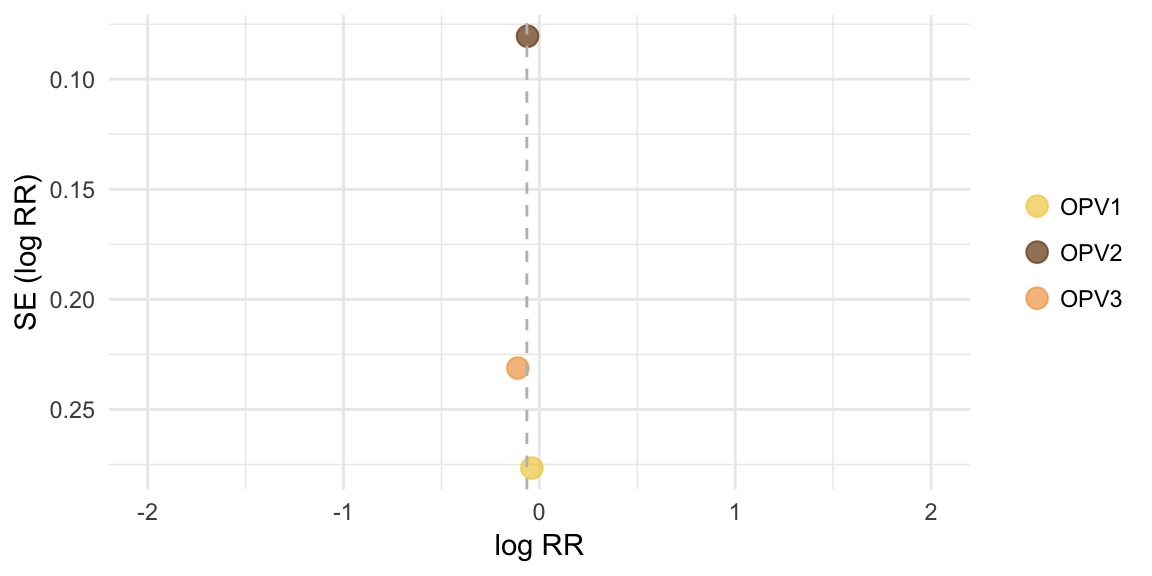
Egger’s test
Infants replicated across vaccines, therefore separate tests performed
## [1] "OPV1:"## [1] "Insufficient studies (n<3)"## [1] "OPV2:"## [1] "Insufficient studies (n<3)"## [1] "OPV3:"## [1] "Insufficient studies (n<3)"Meta-analysis output
##
## Multivariate Meta-Analysis Model (k = 3; method: REML)
##
##   logLik  Deviance       AIC       BIC      AICc
##   1.3423   -2.6846   -0.6846   -1.9915    3.3154
##
## Variance Components:
##
##             estim    sqrt  nlvls  fixed     factor
## sigma^2    0.0000  0.0000      1    yes  Reference
##
## Test for Heterogeneity:
## Q(df = 2) = 0.0502, p-val = 0.9752
##
## Model Results:
##
## estimate      se     zval    pval    ci.lb   ci.ub
##  -0.0638  0.0733  -0.8702  0.3842  -0.2074  0.0798
##
## ---
## Signif. codes:  0 '***' 0.001 '**' 0.01 '*' 0.05 '.' 0.1 ' ' 1
Meta-regression output
##
## Multivariate Meta-Analysis Model (k = 3; method: REML)
##
## Variance Components:
##
##             estim    sqrt  nlvls  fixed     factor
## sigma^2    0.0000  0.0000      1    yes  Reference
##
## Test for Residual Heterogeneity:
## QE(df = 0) = 0.0000, p-val = 1.0000
##
## Test of Moderators (coefficient(s) 2:3):
## QM(df = 2) = 0.0502, p-val = 0.9752
##
## Model Results:
##
##                         estimate      se     zval    pval    ci.lb   ci.ub
## intrcpt                  -0.0382  0.2766  -0.1379  0.8903  -0.5804  0.5041
## Measure_of_SCOPV2 N-AB   -0.0222  0.2881  -0.0770  0.9386  -0.5869  0.5425
## Measure_of_SCOPV3 N-AB   -0.0717  0.3605  -0.1990  0.8423  -0.7784  0.6349
##
## intrcpt
## Measure_of_SCOPV2 N-AB
## Measure_of_SCOPV3 N-AB
##
## ---
## Signif. codes:  0 '***' 0.001 '**' 0.01 '*' 0.05 '.' 0.1 ' ' 1
Serotype-specific outputs
Summary of PV1 studies
## [1] "Insufficient studies (n<2)"Summary of PV2 studies
## [1] "Insufficient studies (n<2)"Summary of PV3 studies
## [1] "Insufficient studies (n<2)"