Increased vaccine inoculum
Full analysis
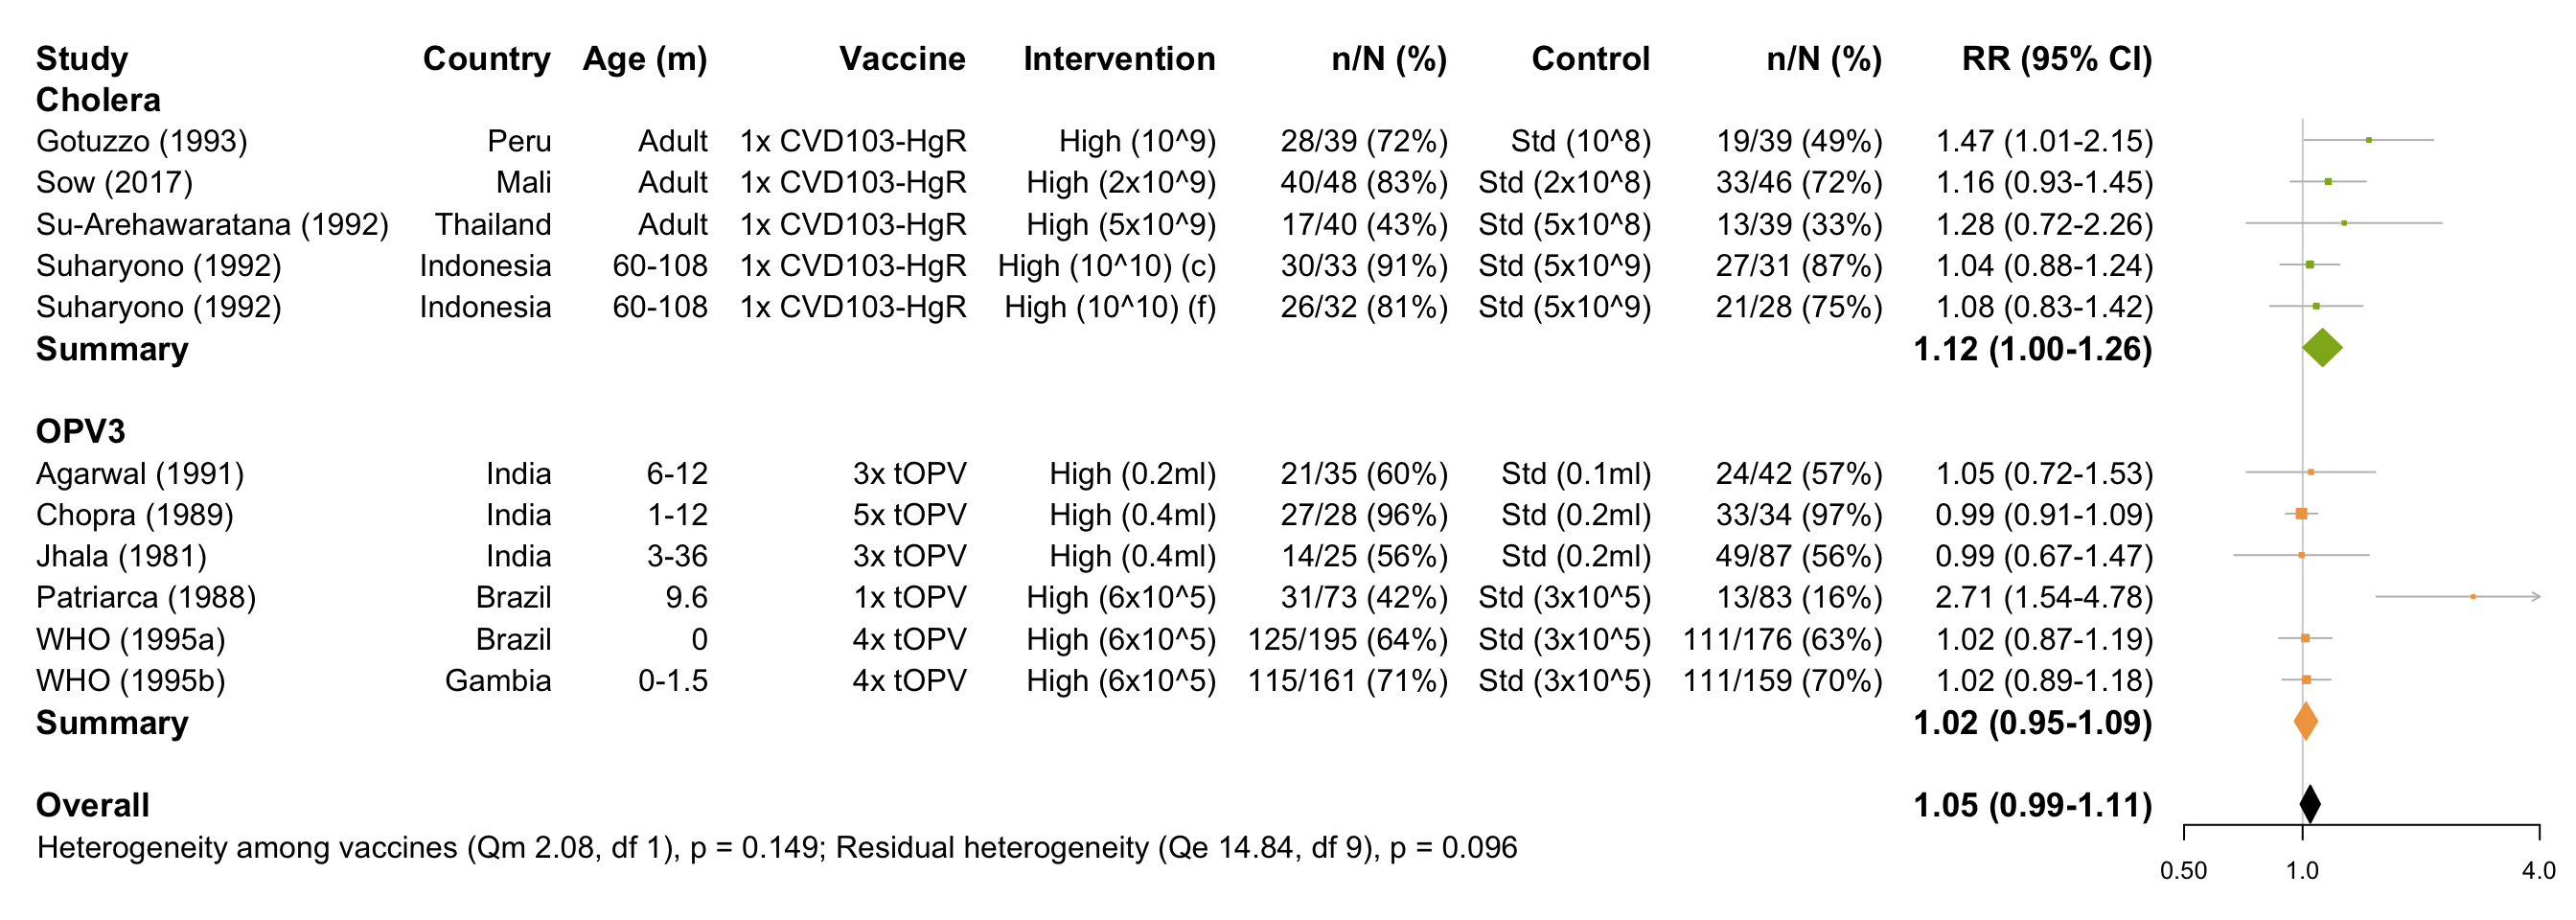
Forest plot
Funnel plot
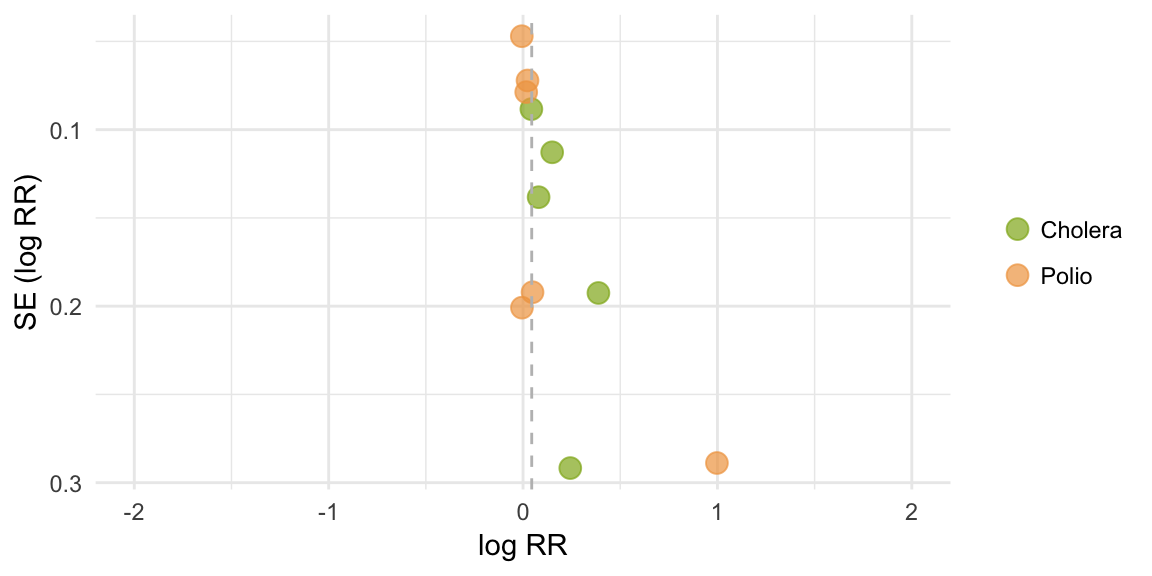
Egger’s test
## [1] "No replication of infants across vaccines or significant vaccine effect, therefore combined test performed"##
## Regression Test for Funnel Plot Asymmetry
##
## model: mixed-effects meta-regression model
## predictor: standard error
##
## test for funnel plot asymmetry: z = 2.9359, p = 0.0033Meta-analysis output
##
## Random-Effects Model (k = 11; tau^2 estimator: REML)
##
##   logLik  deviance       AIC       BIC      AICc
##   2.2089   -4.4178   -0.4178    0.1874    1.2965
##
## tau^2 (estimated amount of total heterogeneity): 0.0000 (SE = 0.0034)
## tau (square root of estimated tau^2 value):      0.0021
## I^2 (total heterogeneity / total variability):   0.04%
## H^2 (total variability / sampling variability):  1.00
##
## Test for Heterogeneity:
## Q(df = 10) = 16.9197, p-val = 0.0762
##
## Model Results:
##
## estimate      se    zval    pval    ci.lb   ci.ub
##   0.0446  0.0293  1.5222  0.1280  -0.0128  0.1020
##
## ---
## Signif. codes:  0 '***' 0.001 '**' 0.01 '*' 0.05 '.' 0.1 ' ' 1
Meta-regression output
##
## Mixed-Effects Model (k = 11; tau^2 estimator: REML)
##
## tau^2 (estimated amount of residual heterogeneity):     0.0000 (SE = 0.0038)
## tau (square root of estimated tau^2 value):             0.0010
## I^2 (residual heterogeneity / unaccounted variability): 0.01%
## H^2 (unaccounted variability / sampling variability):   1.00
## R^2 (amount of heterogeneity accounted for):            78.23%
##
## Test for Residual Heterogeneity:
## QE(df = 9) = 14.8352, p-val = 0.0956
##
## Test of Moderators (coefficient(s) 2):
## QM(df = 1) = 2.0840, p-val = 0.1488
##
## Model Results:
##
##               estimate      se     zval    pval    ci.lb   ci.ub
## intrcpt         0.1168  0.0580   2.0146  0.0439   0.0032  0.2304  *
## VaccinePolio   -0.0970  0.0672  -1.4436  0.1488  -0.2286  0.0347
##
## ---
## Signif. codes:  0 '***' 0.001 '**' 0.01 '*' 0.05 '.' 0.1 ' ' 1
Intervention-specific outputs
Summary of cholera studies
##
## Random-Effects Model (k = 5; tau^2 estimator: REML)
##
##   logLik  deviance       AIC       BIC      AICc
##   2.2349   -4.4697   -0.4697   -1.6971   11.5303
##
## tau^2 (estimated amount of total heterogeneity): 0 (SE = 0.0114)
## tau (square root of estimated tau^2 value):      0
## I^2 (total heterogeneity / total variability):   0.00%
## H^2 (total variability / sampling variability):  1.00
##
## Test for Heterogeneity:
## Q(df = 4) = 3.0247, p-val = 0.5537
##
## Model Results:
##
## estimate      se    zval    pval   ci.lb   ci.ub
##   0.1168  0.0580  2.0147  0.0439  0.0032  0.2304  *
##
## ---
## Signif. codes:  0 '***' 0.001 '**' 0.01 '*' 0.05 '.' 0.1 ' ' 1
Summary of rotavirus studies
## [1] "Insufficient studies (n<2)"Summary of PV3 studies
##
## Random-Effects Model (k = 6; tau^2 estimator: REML)
##
##   logLik  deviance       AIC       BIC      AICc
##  -0.2638    0.5277    4.5277    3.7465   10.5277
##
## tau^2 (estimated amount of total heterogeneity): 0.0000 (SE = 0.0040)
## tau (square root of estimated tau^2 value):      0.0009
## I^2 (total heterogeneity / total variability):   0.01%
## H^2 (total variability / sampling variability):  1.00
##
## Test for Heterogeneity:
## Q(df = 5) = 11.8105, p-val = 0.0375
##
## Model Results:
##
## estimate      se    zval    pval    ci.lb   ci.ub
##   0.0198  0.0339  0.5841  0.5591  -0.0467  0.0863
##
## ---
## Signif. codes:  0 '***' 0.001 '**' 0.01 '*' 0.05 '.' 0.1 ' ' 1
Meta-regression: secondary moderators
Age group
## [1] "Residual heterogeneity not significant (p>0.05)"Income setting
## [1] "Residual heterogeneity not significant (p>0.05)"Background immunogenicity (seroconversion rate in the control group)
## [1] "Residual heterogeneity not significant (p>0.05)"OPV-specific analysis
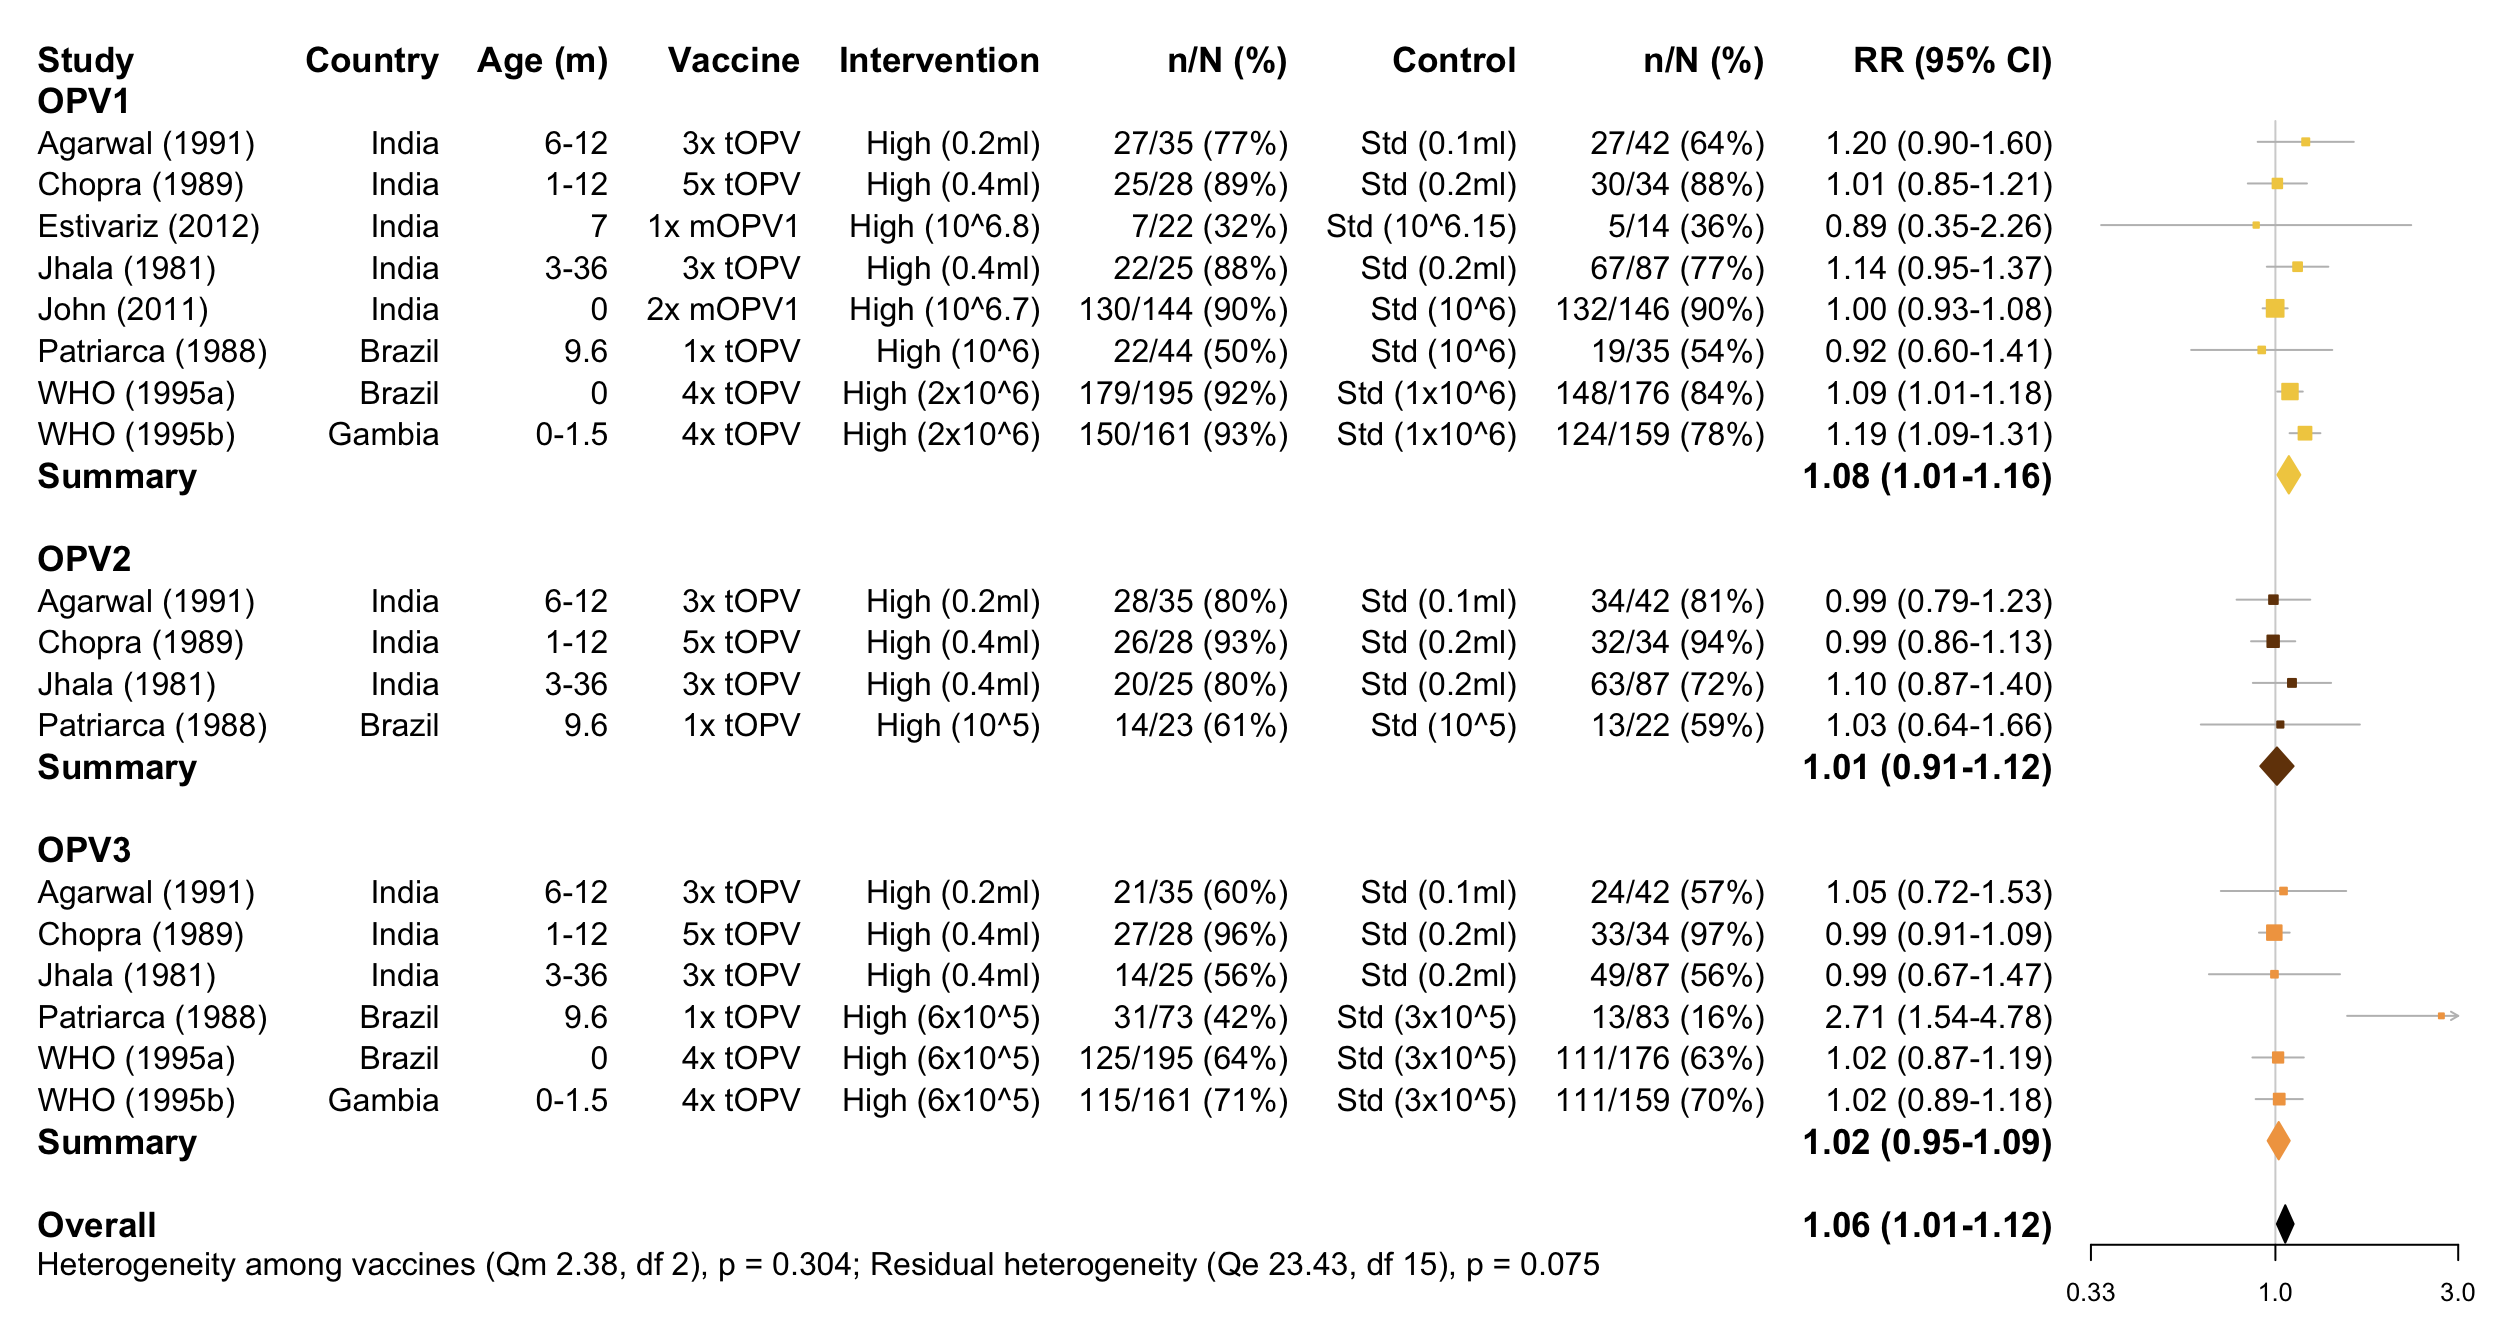
Forest plot
Funnel plot
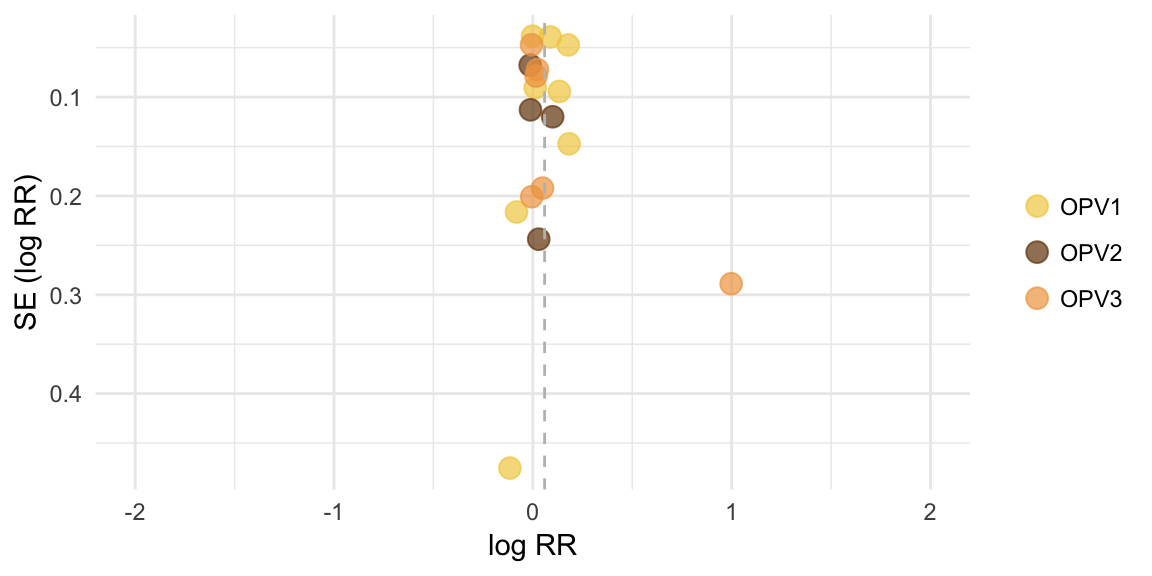
Egger’s test
Infants replicated across vaccines, therefore separate tests performed
## [1] "OPV1:"##
## Regression Test for Funnel Plot Asymmetry
##
## model: mixed-effects meta-regression model
## predictor: standard error
##
## test for funnel plot asymmetry: z = -0.3263, p = 0.7442## [1] "OPV2:"##
## Regression Test for Funnel Plot Asymmetry
##
## model: mixed-effects meta-regression model
## predictor: standard error
##
## test for funnel plot asymmetry: z = 0.4036, p = 0.6865## [1] "OPV3:"##
## Regression Test for Funnel Plot Asymmetry
##
## model: mixed-effects meta-regression model
## predictor: standard error
##
## test for funnel plot asymmetry: z = 2.2139, p = 0.0268Meta-analysis output
##
## Multivariate Meta-Analysis Model (k = 18; method: REML)
##
##   logLik  Deviance       AIC       BIC      AICc
##   9.3297  -18.6595  -14.6595  -12.9931  -13.8023
##
## Variance Components:
##
##             estim    sqrt  nlvls  fixed     factor
## sigma^2    0.0020  0.0444      8     no  Reference
##
## Test for Heterogeneity:
## Q(df = 17) = 26.2255, p-val = 0.0704
##
## Model Results:
##
## estimate      se    zval    pval   ci.lb   ci.ub
##   0.0593  0.0257  2.3044  0.0212  0.0089  0.1097  *
##
## ---
## Signif. codes:  0 '***' 0.001 '**' 0.01 '*' 0.05 '.' 0.1 ' ' 1
Meta-regression output
##
## Multivariate Meta-Analysis Model (k = 18; method: REML)
##
## Variance Components:
##
##             estim    sqrt  nlvls  fixed     factor
## sigma^2    0.0021  0.0457      8     no  Reference
##
## Test for Residual Heterogeneity:
## QE(df = 15) = 23.4345, p-val = 0.0753
##
## Test of Moderators (coefficient(s) 2:3):
## QM(df = 2) = 2.3801, p-val = 0.3042
##
## Model Results:
##
##                         estimate      se     zval    pval    ci.lb   ci.ub
## intrcpt                   0.0841  0.0306   2.7457  0.0060   0.0241  0.1442
## Measure_of_SCOPV2 N-AB   -0.0665  0.0612  -1.0867  0.2772  -0.1864  0.0534
## Measure_of_SCOPV3 N-AB   -0.0620  0.0446  -1.3904  0.1644  -0.1493  0.0254
##
## intrcpt                 **
## Measure_of_SCOPV2 N-AB
## Measure_of_SCOPV3 N-AB
##
## ---
## Signif. codes:  0 '***' 0.001 '**' 0.01 '*' 0.05 '.' 0.1 ' ' 1
Serotype-specific outputs
Summary of PV1 studies
##
## Random-Effects Model (k = 8; tau^2 estimator: REML)
##
##   logLik  deviance       AIC       BIC      AICc
##   5.2572  -10.5144   -6.5144   -6.6226   -3.5144
##
## tau^2 (estimated amount of total heterogeneity): 0.0035 (SE = 0.0046)
## tau (square root of estimated tau^2 value):      0.0588
## I^2 (total heterogeneity / total variability):   43.40%
## H^2 (total variability / sampling variability):  1.77
##
## Test for Heterogeneity:
## Q(df = 7) = 10.9013, p-val = 0.1430
##
## Model Results:
##
## estimate      se    zval    pval   ci.lb   ci.ub
##   0.0808  0.0352  2.2995  0.0215  0.0119  0.1498  *
##
## ---
## Signif. codes:  0 '***' 0.001 '**' 0.01 '*' 0.05 '.' 0.1 ' ' 1
Summary of PV2 studies
##
## Random-Effects Model (k = 4; tau^2 estimator: REML)
##
##   logLik  deviance       AIC       BIC      AICc
##   3.0074   -6.0148   -2.0148   -3.8175    9.9852
##
## tau^2 (estimated amount of total heterogeneity): 0 (SE = 0.0091)
## tau (square root of estimated tau^2 value):      0
## I^2 (total heterogeneity / total variability):   0.00%
## H^2 (total variability / sampling variability):  1.00
##
## Test for Heterogeneity:
## Q(df = 3) = 0.7227, p-val = 0.8679
##
## Model Results:
##
## estimate      se    zval    pval    ci.lb   ci.ub
##   0.0093  0.0511  0.1819  0.8557  -0.0909  0.1095
##
## ---
## Signif. codes:  0 '***' 0.001 '**' 0.01 '*' 0.05 '.' 0.1 ' ' 1
Summary of PV3 studies
##
## Random-Effects Model (k = 6; tau^2 estimator: REML)
##
##   logLik  deviance       AIC       BIC      AICc
##  -0.2638    0.5277    4.5277    3.7465   10.5277
##
## tau^2 (estimated amount of total heterogeneity): 0.0000 (SE = 0.0040)
## tau (square root of estimated tau^2 value):      0.0009
## I^2 (total heterogeneity / total variability):   0.01%
## H^2 (total variability / sampling variability):  1.00
##
## Test for Heterogeneity:
## Q(df = 5) = 11.8105, p-val = 0.0375
##
## Model Results:
##
## estimate      se    zval    pval    ci.lb   ci.ub
##   0.0198  0.0339  0.5841  0.5591  -0.0467  0.0863
##
## ---
## Signif. codes:  0 '***' 0.001 '**' 0.01 '*' 0.05 '.' 0.1 ' ' 1