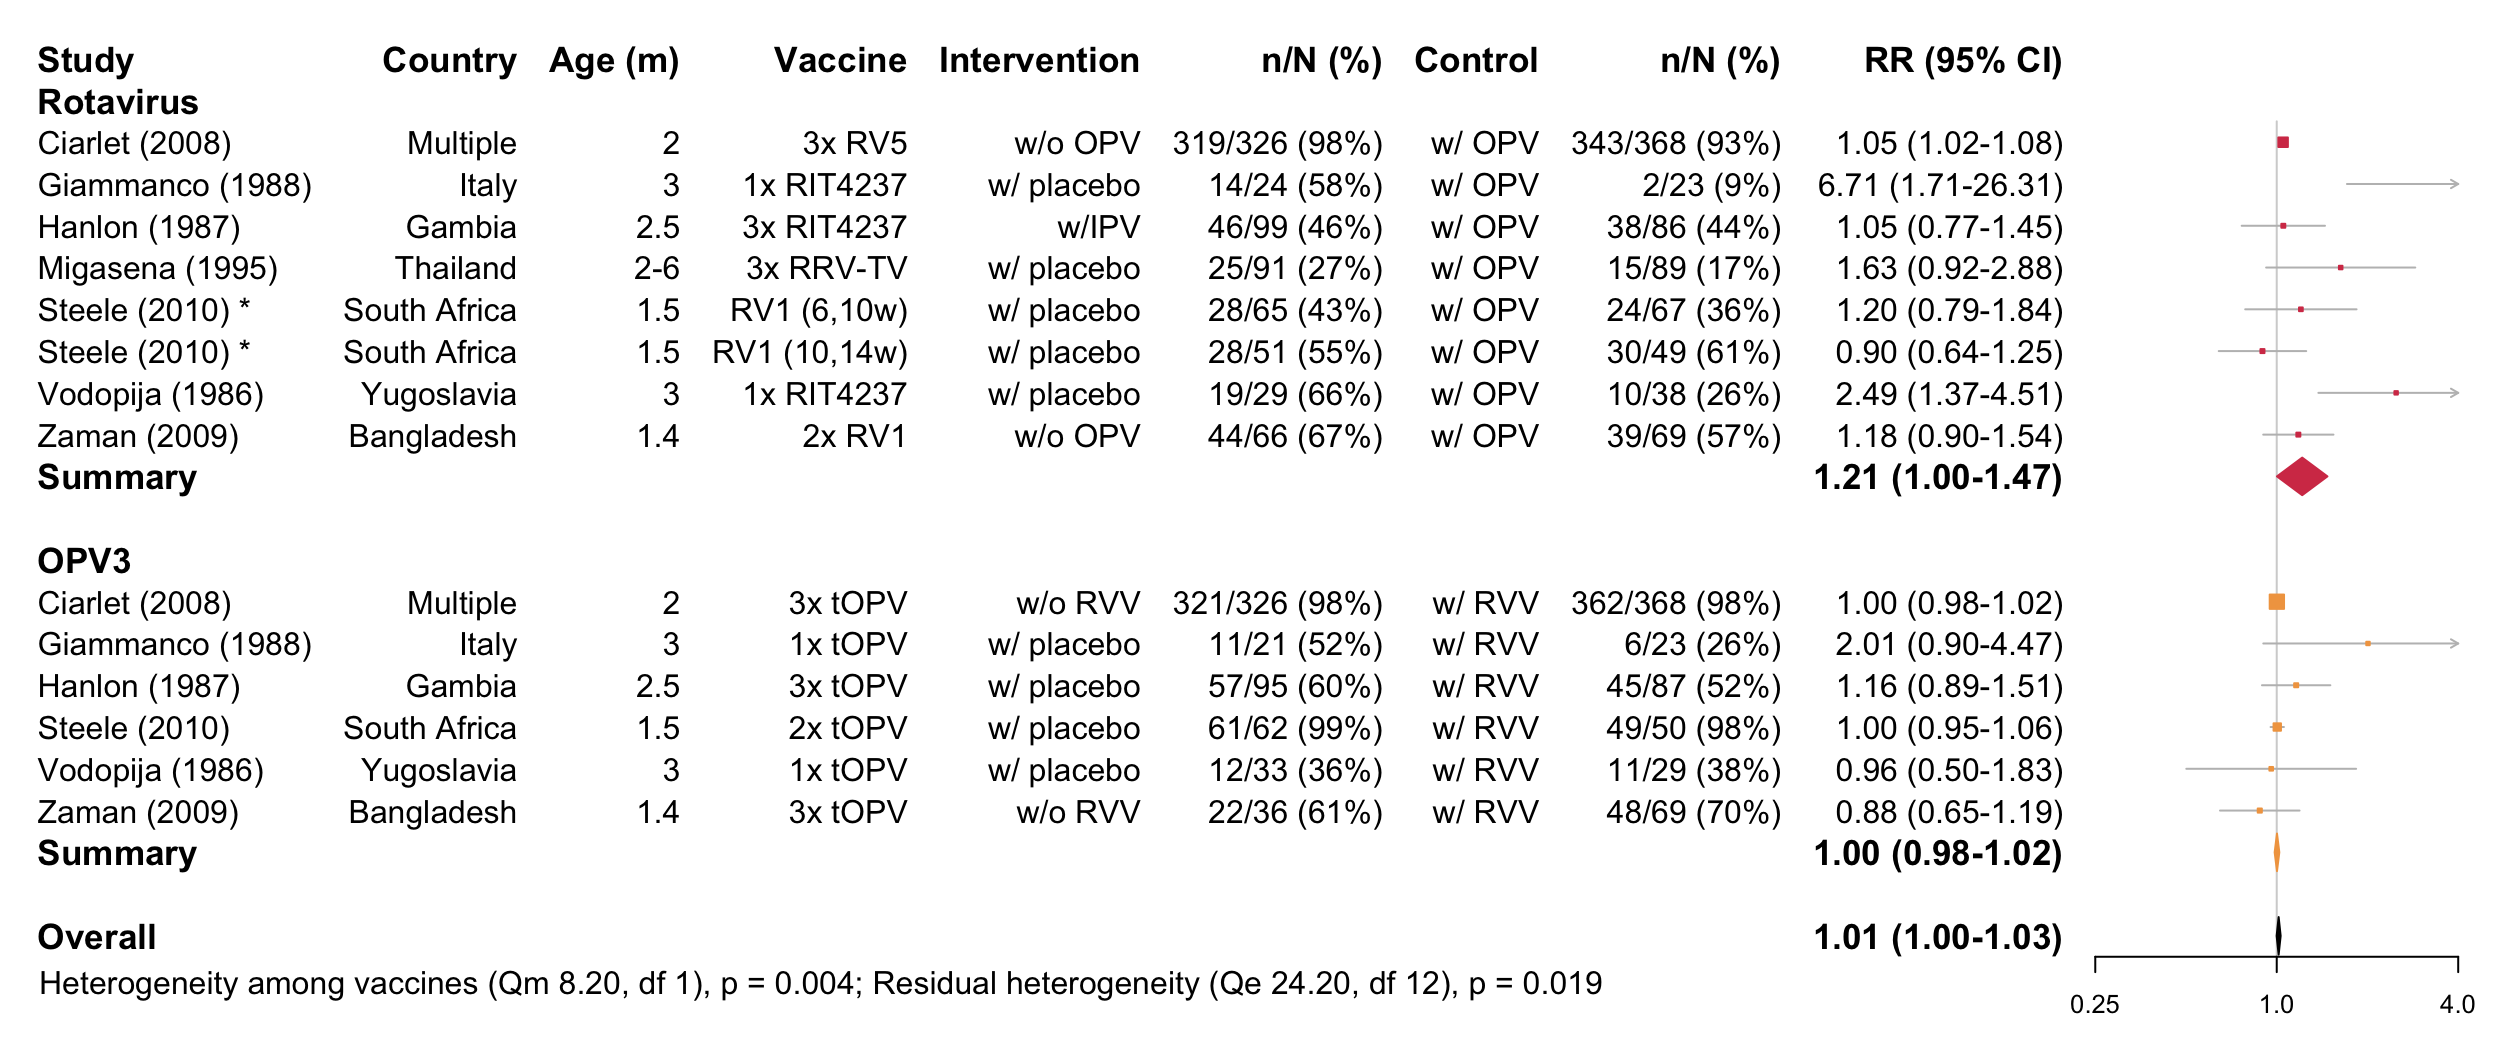
RVV separated from OPV
Full analysis
Forest plot
Funnel plot
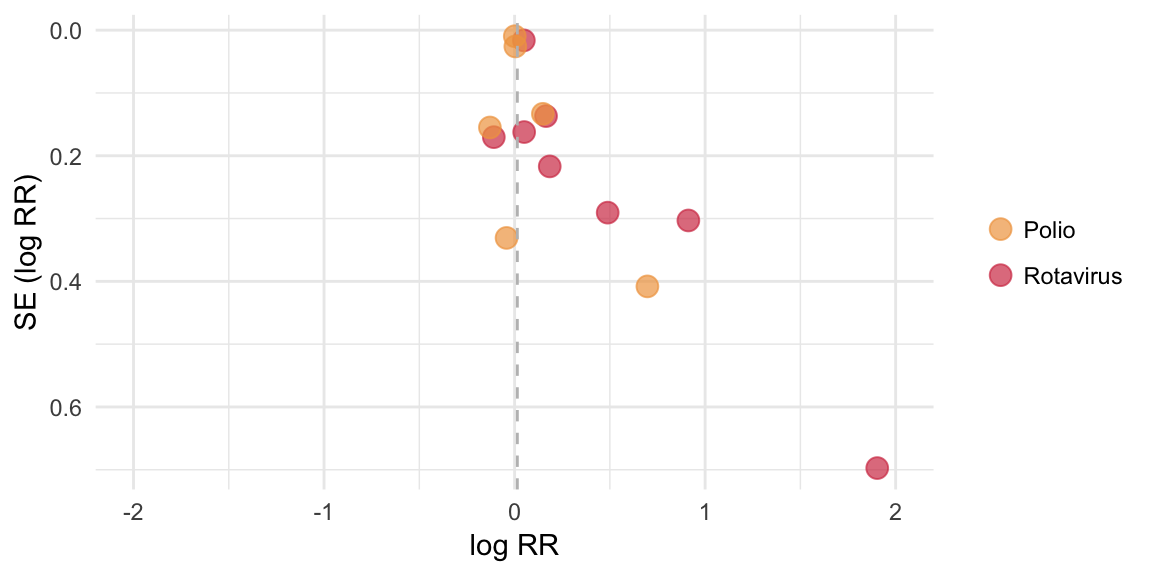
Egger’s test
## [1] "Infants replicated across vaccines or vaccine effect significant, therefore separate tests performed"
## [1] "Cholera:"
## [1] "Insufficient studies (n<3)"
## [1] "Rotavirus:"
##
## Regression Test for Funnel Plot Asymmetry
##
## model:     mixed-effects meta-regression model
## predictor: standard error
##
## test for funnel plot asymmetry: z = 2.8257, p = 0.0047
##
## [1] "OPV3:"
##
## Regression Test for Funnel Plot Asymmetry
##
## model:     mixed-effects meta-regression model
## predictor: standard error
##
## test for funnel plot asymmetry: z = 0.9181, p = 0.3586
Meta-analysis output
##
## Multivariate Meta-Analysis Model (k = 14; method: REML)
##
##   logLik  Deviance       AIC       BIC      AICc
##  -3.4877    6.9753   10.9753   12.1052   12.1753
##
## Variance Components:
##
##             estim    sqrt  nlvls  fixed     factor
## sigma^2    0.0000  0.0000      8     no  Reference
##
## Test for Heterogeneity:
## Q(df = 13) = 32.4026, p-val = 0.0021
##
## Model Results:
##
## estimate      se    zval    pval    ci.lb   ci.ub
##   0.0145  0.0078  1.8560  0.0635  -0.0008  0.0299  .
##
## ---
## Signif. codes:  0 '***' 0.001 '**' 0.01 '*' 0.05 '.' 0.1 ' ' 1
Meta-regression output
##
## Multivariate Meta-Analysis Model (k = 14; method: REML)
##
## Variance Components:
##
##             estim    sqrt  nlvls  fixed     factor
## sigma^2    0.0000  0.0000      8     no  Reference
##
## Test for Residual Heterogeneity:
## QE(df = 12) = 24.1985, p-val = 0.0191
##
## Test of Moderators (coefficient(s) 2):
## QM(df = 1) = 8.2041, p-val = 0.0042
##
## Model Results:
##
##                   estimate      se    zval    pval    ci.lb   ci.ub
## intrcpt             0.0019  0.0090  0.2087  0.8347  -0.0157  0.0195
## VaccineRotavirus    0.0524  0.0183  2.8643  0.0042   0.0165  0.0882  **
##
## ---
## Signif. codes:  0 '***' 0.001 '**' 0.01 '*' 0.05 '.' 0.1 ' ' 1
Intervention-specific outputs
Summary of cholera studies
## [1] "Insufficient studies (n<2)"Summary of rotavirus studies
##
## Random-Effects Model (k = 8; tau^2 estimator: REML)
##
##   logLik  deviance       AIC       BIC      AICc
##  -4.5549    9.1098   13.1098   13.0017   16.1098
##
## tau^2 (estimated amount of total heterogeneity): 0.0382 (SE = 0.0384)
## tau (square root of estimated tau^2 value):      0.1955
## I^2 (total heterogeneity / total variability):   64.64%
## H^2 (total variability / sampling variability):  2.83
##
## Test for Heterogeneity:
## Q(df = 7) = 19.3329, p-val = 0.0072
##
## Model Results:
##
## estimate      se    zval    pval   ci.lb   ci.ub
##   0.1945  0.0984  1.9778  0.0480  0.0018  0.3873  *
##
## ---
## Signif. codes:  0 '***' 0.001 '**' 0.01 '*' 0.05 '.' 0.1 ' ' 1
Summary of PV3 studies
##
## Random-Effects Model (k = 6; tau^2 estimator: REML)
##
##   logLik  deviance       AIC       BIC      AICc
##   3.3313   -6.6626   -2.6626   -3.4438    3.3374
##
## tau^2 (estimated amount of total heterogeneity): 0.0000 (SE = 0.0005)
## tau (square root of estimated tau^2 value):      0.0015
## I^2 (total heterogeneity / total variability):   0.12%
## H^2 (total variability / sampling variability):  1.00
##
## Test for Heterogeneity:
## Q(df = 5) = 4.8656, p-val = 0.4325
##
## Model Results:
##
## estimate      se    zval    pval    ci.lb   ci.ub
##   0.0019  0.0091  0.2085  0.8348  -0.0159  0.0197
##
## ---
## Signif. codes:  0 '***' 0.001 '**' 0.01 '*' 0.05 '.' 0.1 ' ' 1
Meta-regression: secondary moderators
Age group
## [1] "No variation in moderator among studies"Income setting
## [1] "Rotavirus-specific analysis performed owing to absence of significant residual heterogeneity for OPV studies"
##
##  low_lowermiddle uppermiddle_high
##                2                6
##
## Multivariate Meta-Analysis Model (k = 8; method: REML)
##
## Variance Components: none
##
## Test for Residual Heterogeneity:
## QE(df = 6) = 18.9604, p-val = 0.0042
##
## Test of Moderators (coefficient(s) 2):
## QM(df = 1) = 0.3725, p-val = 0.5417
##
## Model Results:
##
## estimate se zval pval
## intrcpt 0.1174 0.1046 1.1220 0.2619
## factor(Income_group)uppermiddle_high -0.0646 0.1058 -0.6103 0.5417
## ci.lb ci.ub
## intrcpt -0.0877 0.3224
## factor(Income_group)uppermiddle_high -0.2720 0.1428
##
## ---
## Signif. codes: 0 '***' 0.001 '**' 0.01 '*' 0.05 '.' 0.1 ' ' 1Background immunogenicity (seroconversion rate in the control group)
## [1] "Rotavirus-specific analysis performed owing to absence of significant residual heterogeneity for OPV studies"##
## Multivariate Meta-Analysis Model (k = 8; method: REML)
##
## Variance Components: none
##
## Test for Residual Heterogeneity:
## QE(df = 6) = 13.5770, p-val = 0.0347
##
## Test of Moderators (coefficient(s) 2):
## QM(df = 1) = 5.7559, p-val = 0.0164
##
## Model Results:
##
## estimate se zval pval
## intrcpt 0.4711 0.1745 2.7002 0.0069
## asin(sqrt(Baseline_seroconversion)) -0.3249 0.1354 -2.3991 0.0164
## ci.lb ci.ub
## intrcpt 0.1292 0.8131 **
## asin(sqrt(Baseline_seroconversion)) -0.5904 -0.0595 *
##
## ---
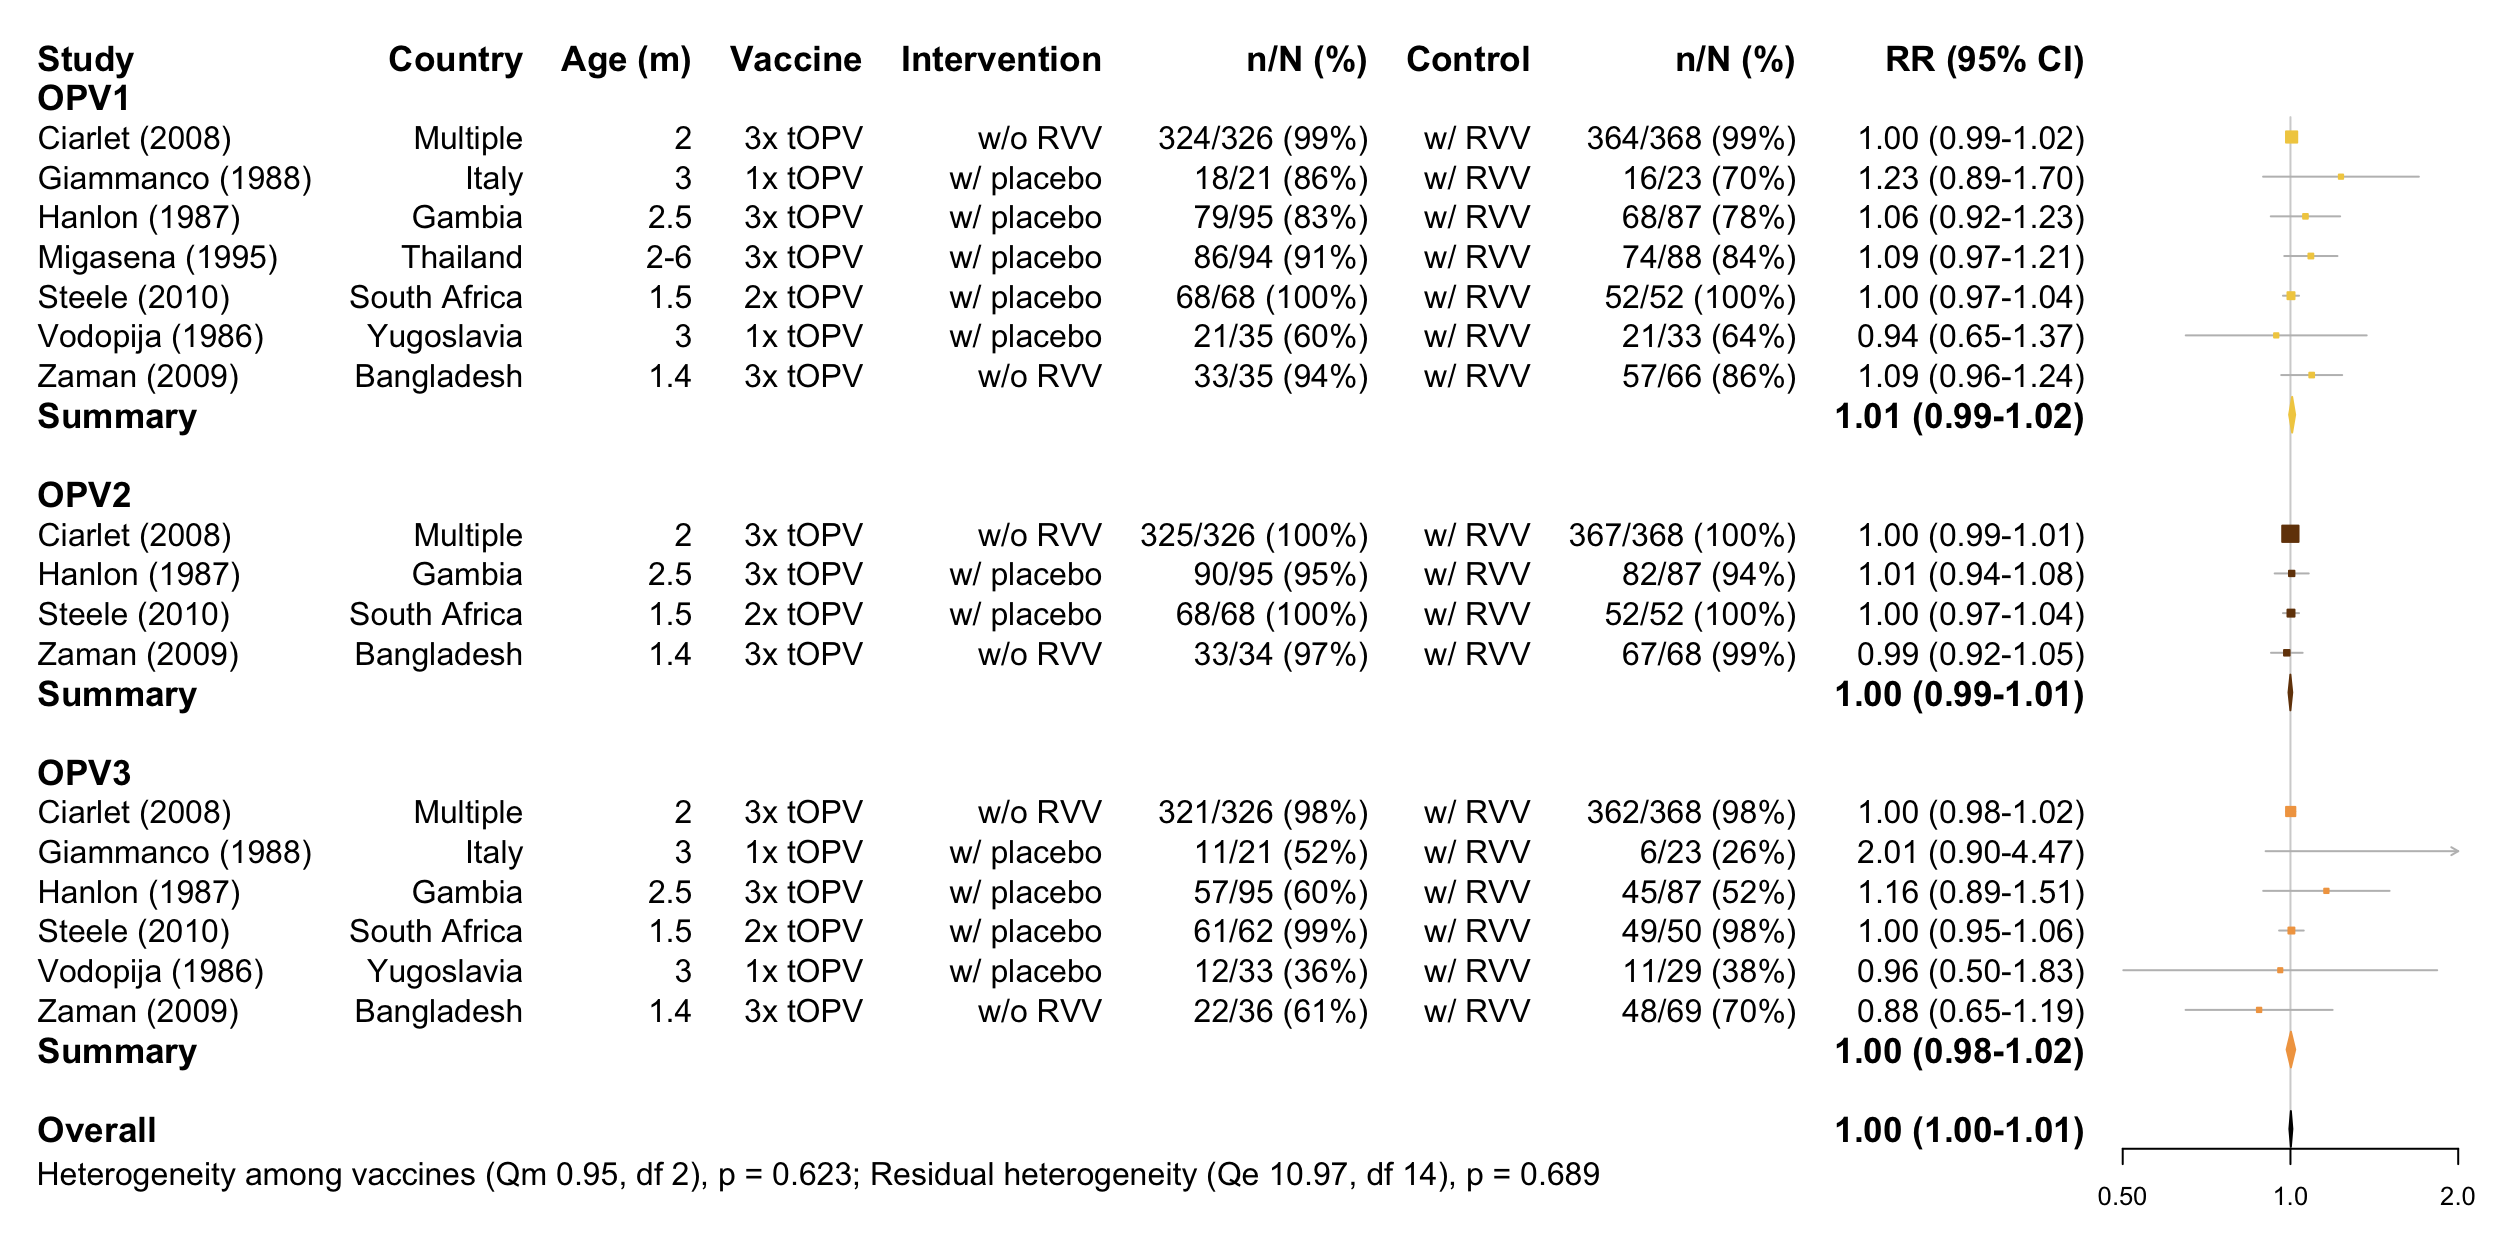
## Signif. codes: 0 '***' 0.001 '**' 0.01 '*' 0.05 '.' 0.1 ' ' 1OPV-specific analysis
Forest plot
Funnel plot
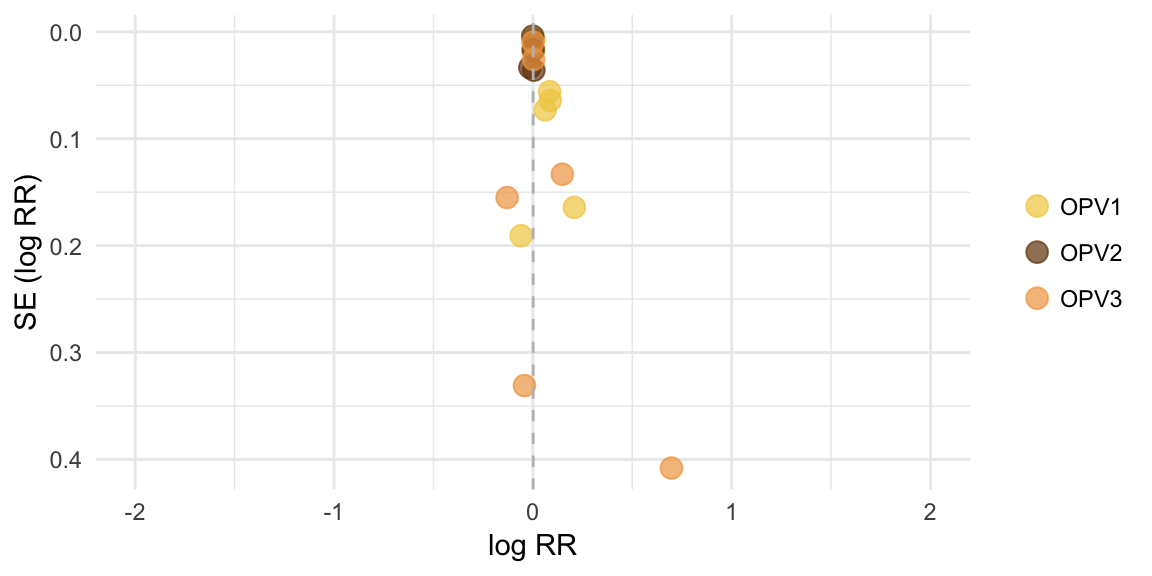
Egger’s test
Infants replicated across vaccines, therefore separate tests performed
## [1] "OPV1:"##
## Regression Test for Funnel Plot Asymmetry
##
## model: mixed-effects meta-regression model
## predictor: standard error
##
## test for funnel plot asymmetry: z = 1.7901, p = 0.0734## [1] "OPV2:"##
## Regression Test for Funnel Plot Asymmetry
##
## model: mixed-effects meta-regression model
## predictor: standard error
##
## test for funnel plot asymmetry: z = -0.0970, p = 0.9227## [1] "OPV3:"##
## Regression Test for Funnel Plot Asymmetry
##
## model: mixed-effects meta-regression model
## predictor: standard error
##
## test for funnel plot asymmetry: z = 0.9181, p = 0.3586Meta-analysis output
##
## Multivariate Meta-Analysis Model (k = 17; method: REML)
##
##   logLik  Deviance       AIC       BIC      AICc
##  26.2267  -52.4533  -48.4533  -46.9081  -47.5302
##
## Variance Components:
##
##             estim    sqrt  nlvls  fixed     factor
## sigma^2    0.0000  0.0000      7     no  Reference
##
## Test for Heterogeneity:
## Q(df = 16) = 11.9142, p-val = 0.7499
##
## Model Results:
##
## estimate      se    zval    pval    ci.lb   ci.ub
##   0.0017  0.0031  0.5392  0.5897  -0.0045  0.0078
##
## ---
## Signif. codes:  0 '***' 0.001 '**' 0.01 '*' 0.05 '.' 0.1 ' ' 1
Meta-regression output
##
## Multivariate Meta-Analysis Model (k = 17; method: REML)
##
## Variance Components:
##
##             estim    sqrt  nlvls  fixed     factor
## sigma^2    0.0000  0.0000      7     no  Reference
##
## Test for Residual Heterogeneity:
## QE(df = 14) = 10.9686, p-val = 0.6885
##
## Test of Moderators (coefficient(s) 2:3):
## QM(df = 2) = 0.9456, p-val = 0.6232
##
## Model Results:
##
##                         estimate      se     zval    pval    ci.lb   ci.ub
## intrcpt                   0.0069  0.0063   1.0885  0.2764  -0.0055  0.0194
## Measure_of_SCOPV2 N-AB   -0.0073  0.0075  -0.9722  0.3310  -0.0219  0.0074
## Measure_of_SCOPV3 N-AB   -0.0050  0.0110  -0.4574  0.6474  -0.0266  0.0165
##
## intrcpt
## Measure_of_SCOPV2 N-AB
## Measure_of_SCOPV3 N-AB
##
## ---
## Signif. codes:  0 '***' 0.001 '**' 0.01 '*' 0.05 '.' 0.1 ' ' 1
Serotype-specific outputs
Summary of PV1 studies
##
## Random-Effects Model (k = 7; tau^2 estimator: REML)
##
##   logLik  deviance       AIC       BIC      AICc
##   8.2203  -16.4405  -12.4405  -12.8570   -8.4405
##
## tau^2 (estimated amount of total heterogeneity): 0 (SE = 0.0002)
## tau (square root of estimated tau^2 value):      0
## I^2 (total heterogeneity / total variability):   0.00%
## H^2 (total variability / sampling variability):  1.00
##
## Test for Heterogeneity:
## Q(df = 6) = 5.8625, p-val = 0.4388
##
## Model Results:
##
## estimate      se    zval    pval    ci.lb   ci.ub
##   0.0069  0.0063  1.0885  0.2764  -0.0055  0.0194
##
## ---
## Signif. codes:  0 '***' 0.001 '**' 0.01 '*' 0.05 '.' 0.1 ' ' 1
Summary of PV2 studies
##
## Random-Effects Model (k = 4; tau^2 estimator: REML)
##
##   logLik  deviance       AIC       BIC      AICc
##   8.5846  -17.1691  -13.1691  -14.9719   -1.1691
##
## tau^2 (estimated amount of total heterogeneity): 0 (SE = 0.0002)
## tau (square root of estimated tau^2 value):      0
## I^2 (total heterogeneity / total variability):   0.00%
## H^2 (total variability / sampling variability):  1.00
##
## Test for Heterogeneity:
## Q(df = 3) = 0.2404, p-val = 0.9708
##
## Model Results:
##
## estimate      se     zval    pval    ci.lb   ci.ub
##  -0.0004  0.0039  -0.0892  0.9289  -0.0081  0.0074
##
## ---
## Signif. codes:  0 '***' 0.001 '**' 0.01 '*' 0.05 '.' 0.1 ' ' 1
Summary of PV3 studies
##
## Random-Effects Model (k = 6; tau^2 estimator: REML)
##
##   logLik  deviance       AIC       BIC      AICc
##   3.3313   -6.6626   -2.6626   -3.4438    3.3374
##
## tau^2 (estimated amount of total heterogeneity): 0.0000 (SE = 0.0005)
## tau (square root of estimated tau^2 value):      0.0015
## I^2 (total heterogeneity / total variability):   0.12%
## H^2 (total variability / sampling variability):  1.00
##
## Test for Heterogeneity:
## Q(df = 5) = 4.8656, p-val = 0.4325
##
## Model Results:
##
## estimate      se    zval    pval    ci.lb   ci.ub
##   0.0019  0.0091  0.2085  0.8348  -0.0159  0.0197
##
## ---
## Signif. codes:  0 '***' 0.001 '**' 0.01 '*' 0.05 '.' 0.1 ' ' 1