OPV valence
Full analysis
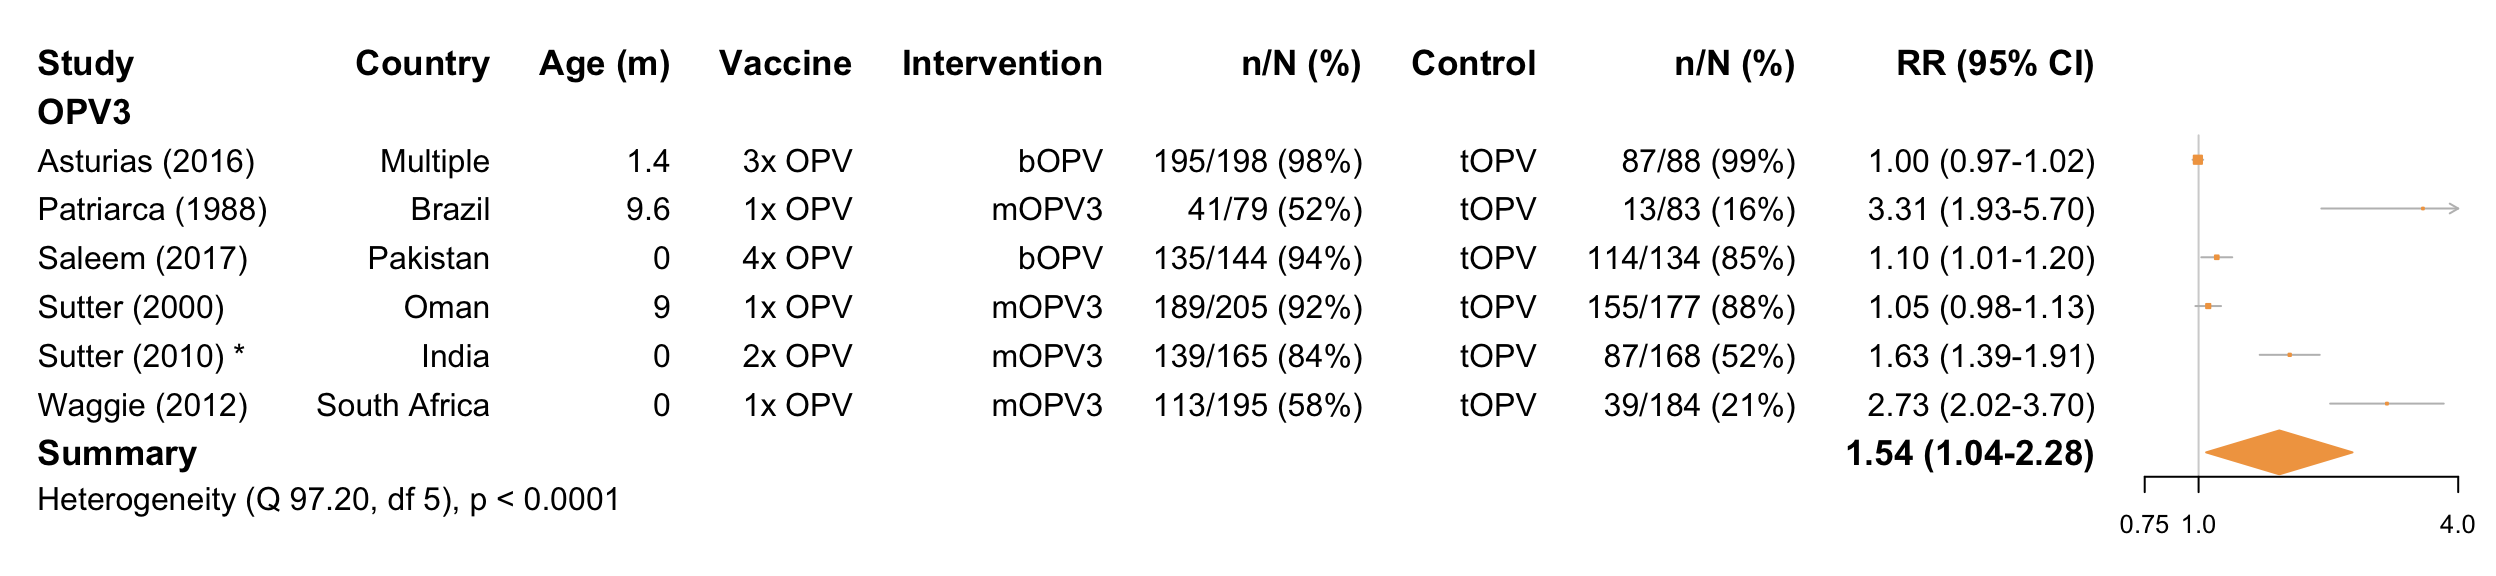
Forest plot
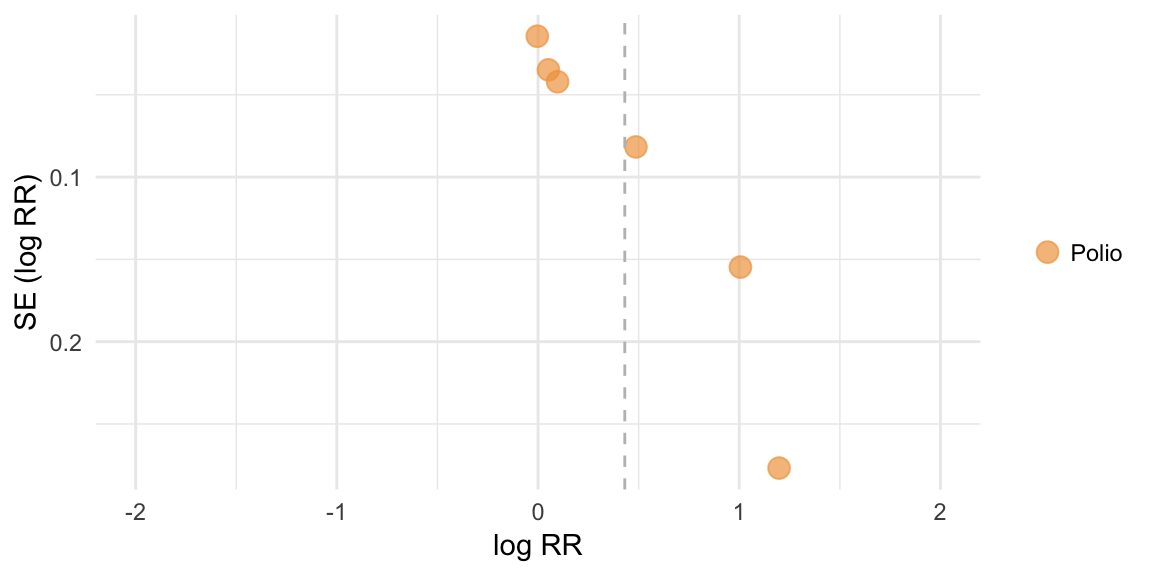
Funnel plot
Egger’s test
## [1] "No replication of infants across vaccines or significant vaccine effect, therefore combined test performed"##
## Regression Test for Funnel Plot Asymmetry
##
## model: mixed-effects meta-regression model
## predictor: standard error
##
## test for funnel plot asymmetry: z = 8.2020, p < .0001Meta-analysis output
##
## Random-Effects Model (k = 6; tau^2 estimator: REML)
##
##   logLik  deviance       AIC       BIC      AICc
##  -3.6799    7.3597   11.3597   10.5786   17.3597
##
## tau^2 (estimated amount of total heterogeneity): 0.2230 (SE = 0.1506)
## tau (square root of estimated tau^2 value):      0.4722
## I^2 (total heterogeneity / total variability):   99.15%
## H^2 (total variability / sampling variability):  118.18
##
## Test for Heterogeneity:
## Q(df = 5) = 97.1976, p-val < .0001
##
## Model Results:
##
## estimate      se    zval    pval   ci.lb   ci.ub
##   0.4311  0.1995  2.1615  0.0307  0.0402  0.8221  *
##
## ---
## Signif. codes:  0 '***' 0.001 '**' 0.01 '*' 0.05 '.' 0.1 ' ' 1
Meta-regression output
## [1] "Insufficient studies for meta-regression (either <2 studies or only 1 vaccine type)"Intervention-specific outputs
Summary of cholera studies
## [1] "Insufficient studies (n<2)"Summary of rotavirus studies
## [1] "Insufficient studies (n<2)"Summary of PV3 studies
##
## Random-Effects Model (k = 6; tau^2 estimator: REML)
##
##   logLik  deviance       AIC       BIC      AICc
##  -3.6799    7.3597   11.3597   10.5786   17.3597
##
## tau^2 (estimated amount of total heterogeneity): 0.2230 (SE = 0.1506)
## tau (square root of estimated tau^2 value):      0.4722
## I^2 (total heterogeneity / total variability):   99.15%
## H^2 (total variability / sampling variability):  118.18
##
## Test for Heterogeneity:
## Q(df = 5) = 97.1976, p-val < .0001
##
## Model Results:
##
## estimate      se    zval    pval   ci.lb   ci.ub
##   0.4311  0.1995  2.1615  0.0307  0.0402  0.8221  *
##
## ---
## Signif. codes:  0 '***' 0.001 '**' 0.01 '*' 0.05 '.' 0.1 ' ' 1
Meta-regression: secondary moderators
Age group
## [1] "No variation in moderator among studies"Income setting
##
##  low_lowermiddle uppermiddle_high
##                2                4
##
## Mixed-Effects Model (k = 6; tau^2 estimator: REML)
##
## tau^2 (estimated amount of residual heterogeneity): 0.2792 (SE = 0.2099)
## tau (square root of estimated tau^2 value): 0.5284
## I^2 (residual heterogeneity / unaccounted variability): 99.18%
## H^2 (unaccounted variability / sampling variability): 122.26
## R^2 (amount of heterogeneity accounted for): 0.00%
##
## Test for Residual Heterogeneity:
## QE(df = 4) = 80.0459, p-val < .0001
##
## Test of Moderators (coefficient(s) 2):
## QM(df = 1) = 0.2373, p-val = 0.6261
##
## Model Results:
##
## estimate se zval pval
## intrcpt 0.2902 0.3764 0.7708 0.4408
## factor(Income_group)uppermiddle_high 0.2270 0.4660 0.4872 0.6261
## ci.lb ci.ub
## intrcpt -0.4476 1.0279
## factor(Income_group)uppermiddle_high -0.6863 1.1403
##
## ---
## Signif. codes: 0 '***' 0.001 '**' 0.01 '*' 0.05 '.' 0.1 ' ' 1Background immunogenicity (seroconversion rate in the control group)
##
## Mixed-Effects Model (k = 6; tau^2 estimator: REML)
##
## tau^2 (estimated amount of residual heterogeneity):     0.0117 (SE = 0.0120)
## tau (square root of estimated tau^2 value):             0.1081
## I^2 (residual heterogeneity / unaccounted variability): 81.51%
## H^2 (unaccounted variability / sampling variability):   5.41
## R^2 (amount of heterogeneity accounted for):            94.76%
##
## Test for Residual Heterogeneity:
## QE(df = 4) = 22.0549, p-val = 0.0002
##
## Test of Moderators (coefficient(s) 2):
## QM(df = 1) = 35.9598, p-val < .0001
##
## Model Results:
##
##                                      estimate      se     zval    pval
## intrcpt                                1.3892  0.1994   6.9680  <.0001
## asin(sqrt(Baseline_seroconversion))   -1.0354  0.1727  -5.9967  <.0001
##                                        ci.lb    ci.ub
## intrcpt                               0.9984   1.7800  ***
## asin(sqrt(Baseline_seroconversion))  -1.3738  -0.6970  ***
##
## ---
## Signif. codes:  0 '***' 0.001 '**' 0.01 '*' 0.05 '.' 0.1 ' ' 1
OPV-specific analysis
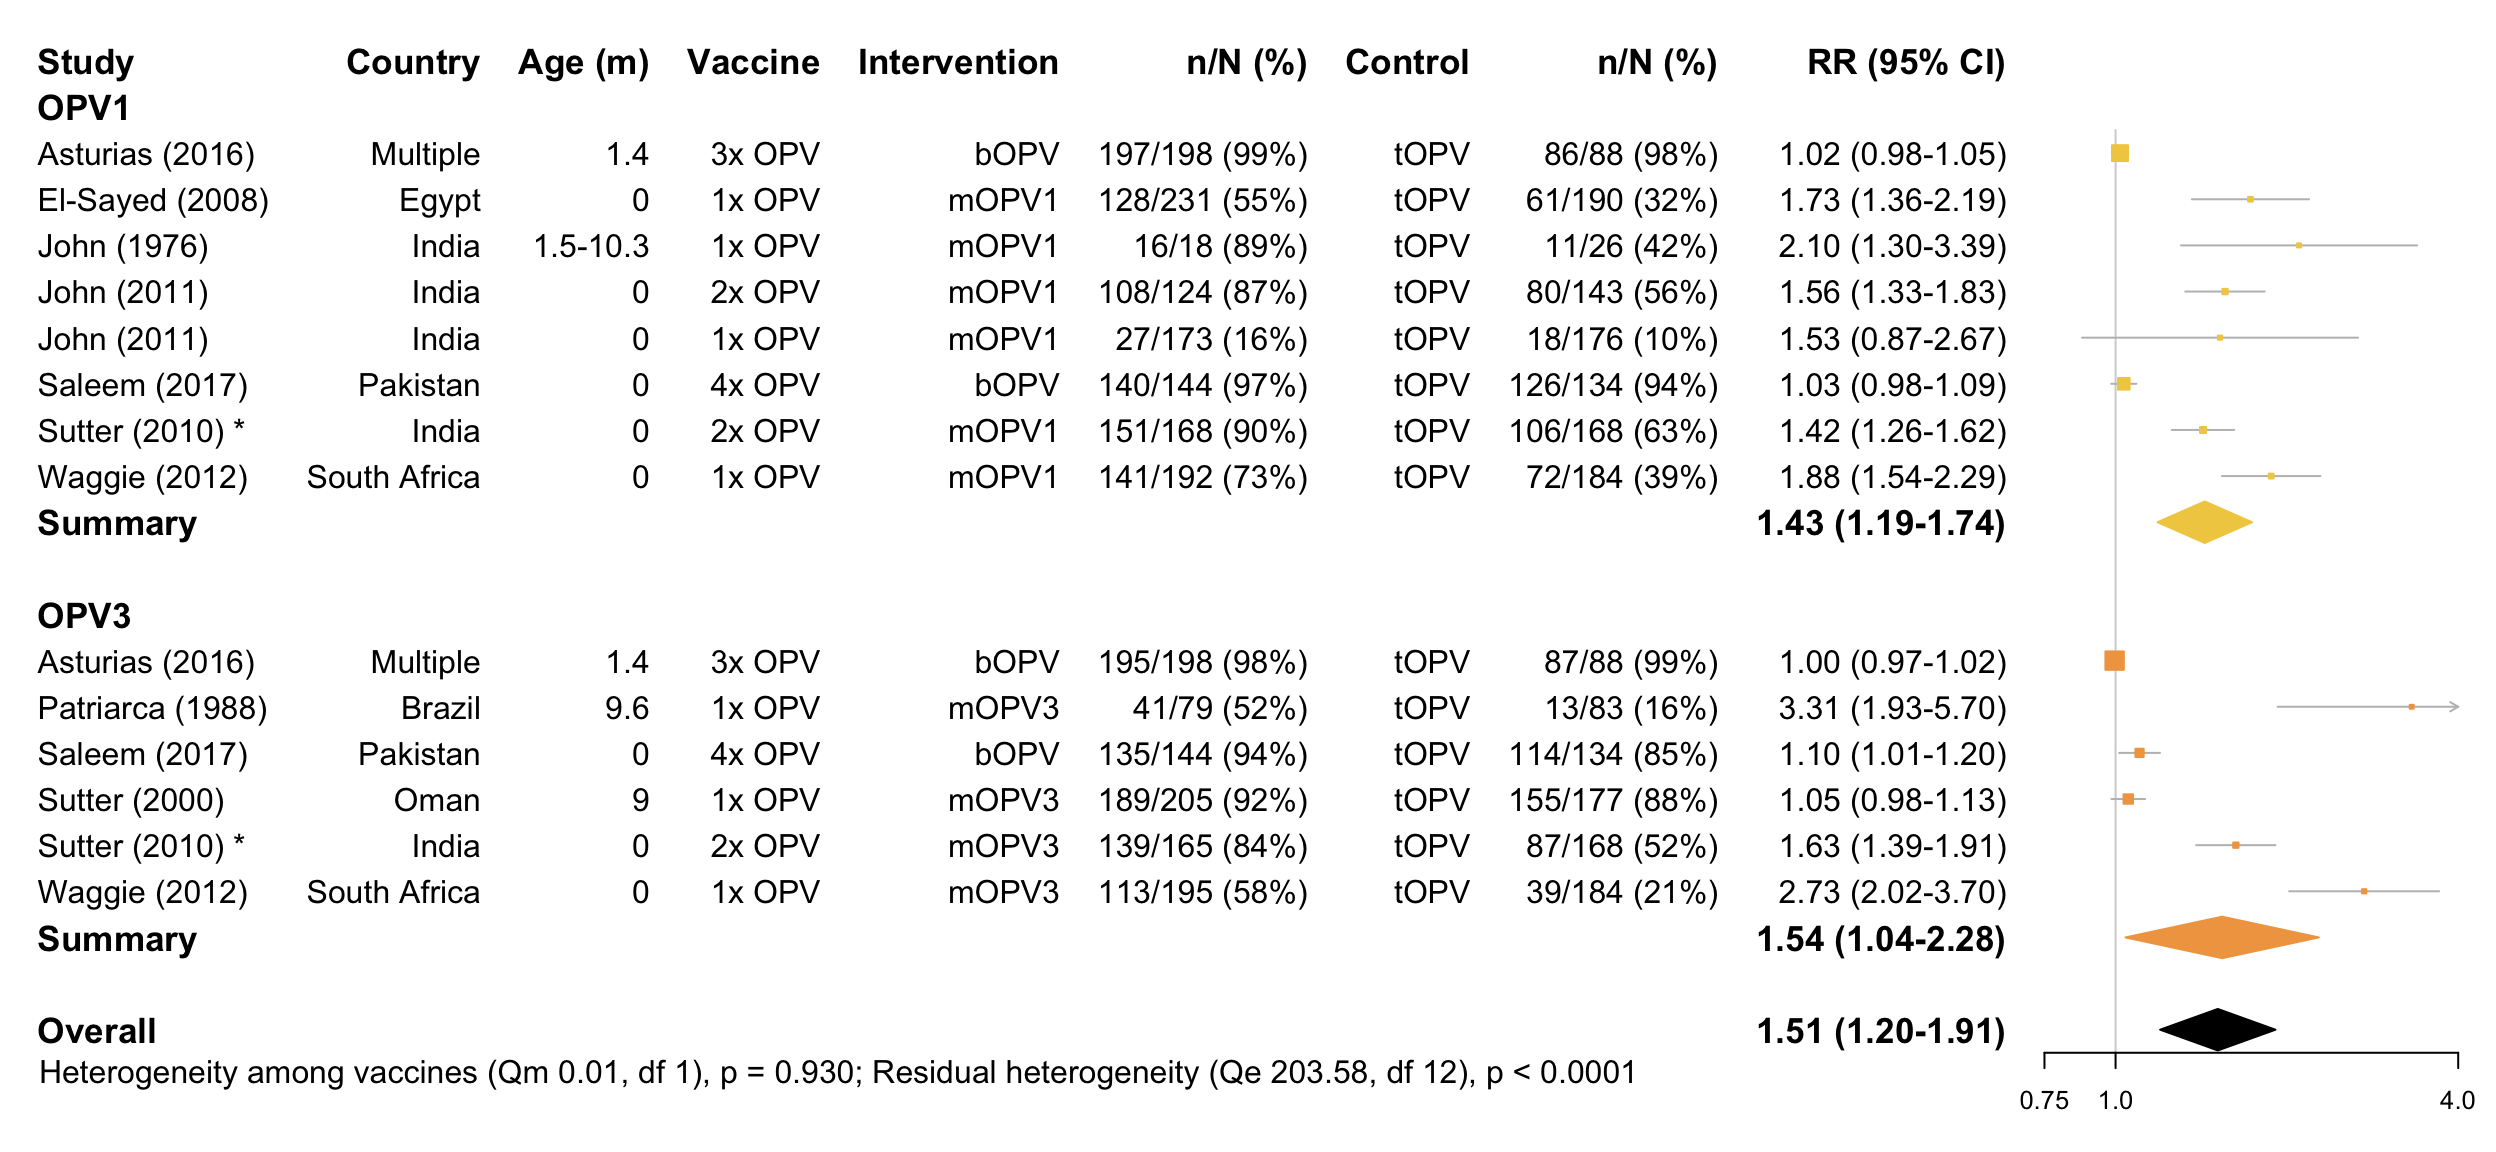
Forest plot
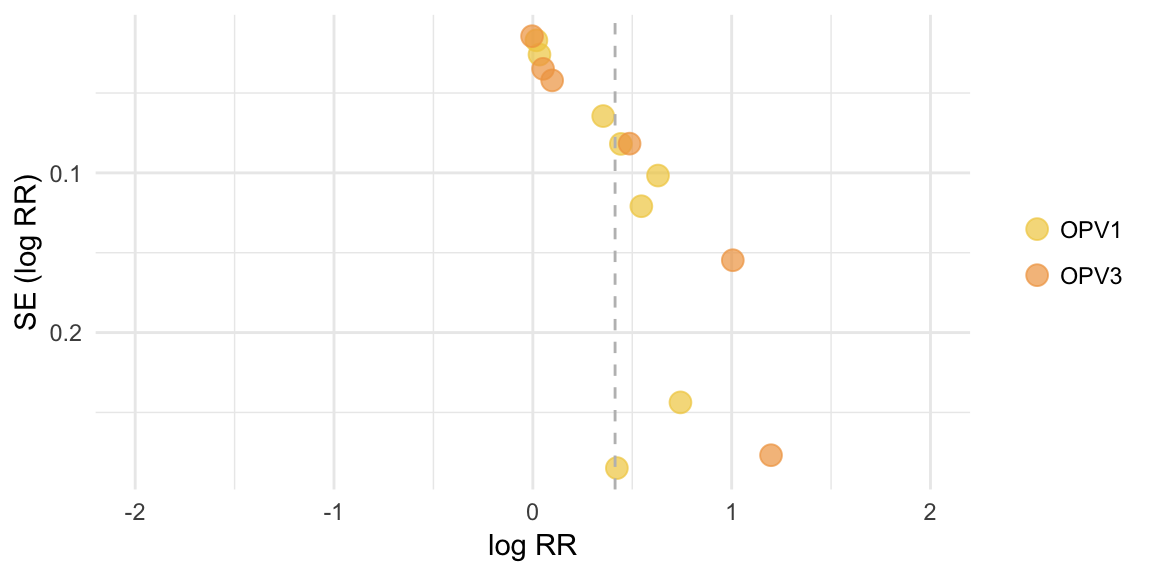
Funnel plot
Egger’s test
Infants replicated across vaccines, therefore separate tests performed
## [1] "OPV1:"##
## Regression Test for Funnel Plot Asymmetry
##
## model: mixed-effects meta-regression model
## predictor: standard error
##
## test for funnel plot asymmetry: z = 2.8675, p = 0.0041## [1] "OPV2:"## [1] "Insufficient studies (n<3)"## [1] "OPV3:"##
## Regression Test for Funnel Plot Asymmetry
##
## model: mixed-effects meta-regression model
## predictor: standard error
##
## test for funnel plot asymmetry: z = 8.2020, p < .0001Meta-analysis output
##
## Multivariate Meta-Analysis Model (k = 14; method: REML)
##
##   logLik  Deviance       AIC       BIC      AICc
##  -0.1142    0.2284    4.2284    5.3583    5.4284
##
## Variance Components:
##
##             estim    sqrt  nlvls  fixed     factor
## sigma^2    0.1132  0.3364      9     no  Reference
##
## Test for Heterogeneity:
## Q(df = 13) = 207.3903, p-val < .0001
##
## Model Results:
##
## estimate      se    zval    pval   ci.lb   ci.ub
##   0.4136  0.1190  3.4751  0.0005  0.1803  0.6469  ***
##
## ---
## Signif. codes:  0 '***' 0.001 '**' 0.01 '*' 0.05 '.' 0.1 ' ' 1
Meta-regression output
##
## Multivariate Meta-Analysis Model (k = 14; method: REML)
##
## Variance Components:
##
##             estim    sqrt  nlvls  fixed     factor
## sigma^2    0.1134  0.3367      9     no  Reference
##
## Test for Residual Heterogeneity:
## QE(df = 12) = 203.5819, p-val < .0001
##
## Test of Moderators (coefficient(s) 2):
## QM(df = 1) = 0.0076, p-val = 0.9303
##
## Model Results:
##
##                         estimate      se    zval    pval    ci.lb   ci.ub
## intrcpt                   0.4130  0.1194  3.4601  0.0005   0.1791  0.6470
## Measure_of_SCOPV3 N-AB    0.0017  0.0198  0.0874  0.9303  -0.0371  0.0406
##
## intrcpt                 ***
## Measure_of_SCOPV3 N-AB
##
## ---
## Signif. codes:  0 '***' 0.001 '**' 0.01 '*' 0.05 '.' 0.1 ' ' 1
Serotype-specific outputs
Summary of PV1 studies
##
## Random-Effects Model (k = 8; tau^2 estimator: REML)
##
##   logLik  deviance       AIC       BIC      AICc
##  -0.8036    1.6071    5.6071    5.4990    8.6071
##
## tau^2 (estimated amount of total heterogeneity): 0.0611 (SE = 0.0399)
## tau (square root of estimated tau^2 value):      0.2472
## I^2 (total heterogeneity / total variability):   96.26%
## H^2 (total variability / sampling variability):  26.74
##
## Test for Heterogeneity:
## Q(df = 7) = 106.3843, p-val < .0001
##
## Model Results:
##
## estimate      se    zval    pval   ci.lb   ci.ub
##   0.3610  0.0976  3.7008  0.0002  0.1698  0.5522  ***
##
## ---
## Signif. codes:  0 '***' 0.001 '**' 0.01 '*' 0.05 '.' 0.1 ' ' 1
Summary of PV2 studies
## [1] "Insufficient studies (n<2)"Summary of PV3 studies
##
## Random-Effects Model (k = 6; tau^2 estimator: REML)
##
##   logLik  deviance       AIC       BIC      AICc
##  -3.6799    7.3597   11.3597   10.5786   17.3597
##
## tau^2 (estimated amount of total heterogeneity): 0.2230 (SE = 0.1506)
## tau (square root of estimated tau^2 value):      0.4722
## I^2 (total heterogeneity / total variability):   99.15%
## H^2 (total variability / sampling variability):  118.18
##
## Test for Heterogeneity:
## Q(df = 5) = 97.1976, p-val < .0001
##
## Model Results:
##
## estimate      se    zval    pval   ci.lb   ci.ub
##   0.4311  0.1995  2.1615  0.0307  0.0402  0.8221  *
##
## ---
## Signif. codes:  0 '***' 0.001 '**' 0.01 '*' 0.05 '.' 0.1 ' ' 1