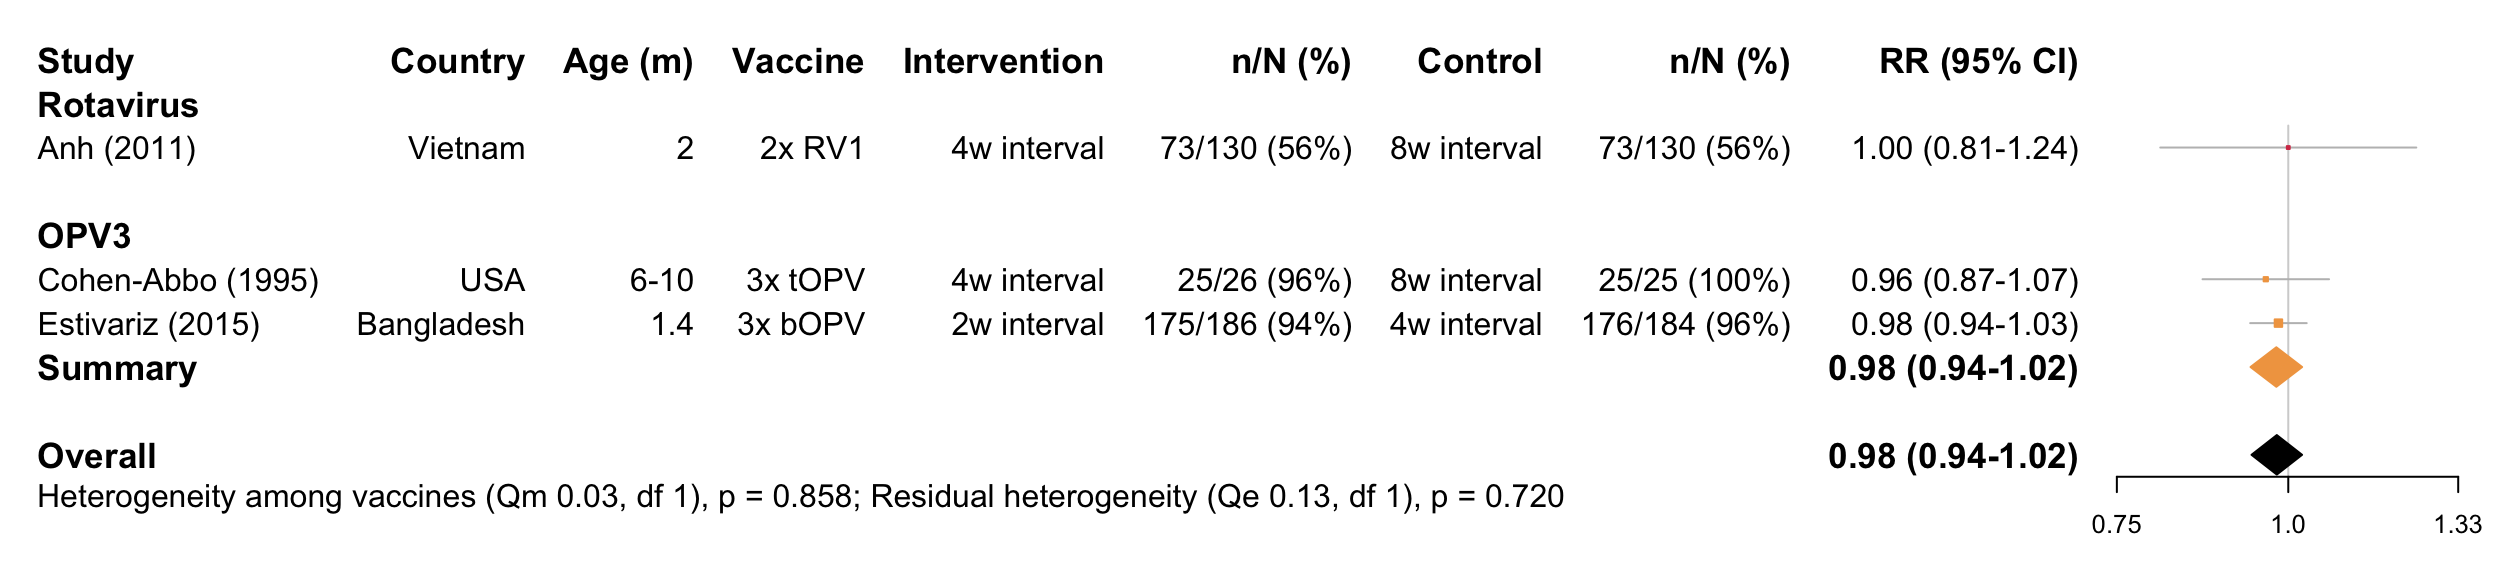
Narrow dose interval
Full analysis
Forest plot
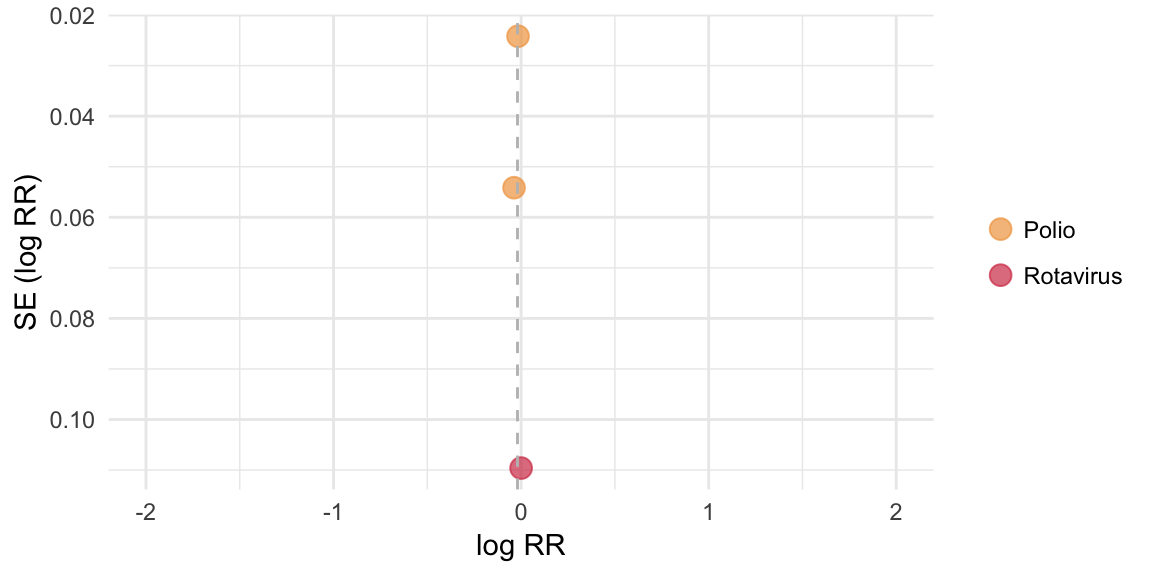
Funnel plot
Egger’s test
## [1] "No replication of infants across vaccines or significant vaccine effect, therefore combined test performed"##
## Regression Test for Funnel Plot Asymmetry
##
## model: mixed-effects meta-regression model
## predictor: standard error
##
## test for funnel plot asymmetry: z = -0.0591, p = 0.9529Meta-analysis output
##
## Random-Effects Model (k = 3; tau^2 estimator: REML)
##
##   logLik  deviance       AIC       BIC      AICc
##   3.6473   -7.2945   -3.2945   -5.9082    8.7055
##
## tau^2 (estimated amount of total heterogeneity): 0 (SE = 0.0023)
## tau (square root of estimated tau^2 value):      0
## I^2 (total heterogeneity / total variability):   0.00%
## H^2 (total variability / sampling variability):  1.00
##
## Test for Heterogeneity:
## Q(df = 2) = 0.1603, p-val = 0.9230
##
## Model Results:
##
## estimate      se     zval    pval    ci.lb   ci.ub
##  -0.0193  0.0216  -0.8895  0.3737  -0.0617  0.0232
##
## ---
## Signif. codes:  0 '***' 0.001 '**' 0.01 '*' 0.05 '.' 0.1 ' ' 1
Meta-regression output
##
## Mixed-Effects Model (k = 3; tau^2 estimator: REML)
##
## tau^2 (estimated amount of residual heterogeneity):     0 (SE = 0.0025)
## tau (square root of estimated tau^2 value):             0
## I^2 (residual heterogeneity / unaccounted variability): 0.00%
## H^2 (unaccounted variability / sampling variability):   1.00
## R^2 (amount of heterogeneity accounted for):            NA%
##
## Test for Residual Heterogeneity:
## QE(df = 1) = 0.1281, p-val = 0.7204
##
## Test of Moderators (coefficient(s) 2):
## QM(df = 1) = 0.0321, p-val = 0.8578
##
## Model Results:
##
##                   estimate      se     zval    pval    ci.lb   ci.ub
## intrcpt            -0.0200  0.0221  -0.9074  0.3642  -0.0633  0.0232
## VaccineRotavirus    0.0200  0.1118   0.1792  0.8578  -0.1991  0.2392
##
## ---
## Signif. codes:  0 '***' 0.001 '**' 0.01 '*' 0.05 '.' 0.1 ' ' 1
Intervention-specific outputs
Summary of cholera studies
## [1] "Insufficient studies (n<2)"Summary of rotavirus studies
## [1] "Insufficient studies (n<2)"Summary of PV3 studies
##
## Random-Effects Model (k = 2; tau^2 estimator: REML)
##
##   logLik  deviance       AIC       BIC      AICc
##   2.1885   -4.3771   -0.3771   -4.3771   11.6229
##
## tau^2 (estimated amount of total heterogeneity): 0 (SE = 0.0025)
## tau (square root of estimated tau^2 value):      0
## I^2 (total heterogeneity / total variability):   0.00%
## H^2 (total variability / sampling variability):  1.00
##
## Test for Heterogeneity:
## Q(df = 1) = 0.1281, p-val = 0.7204
##
## Model Results:
##
## estimate      se     zval    pval    ci.lb   ci.ub
##  -0.0200  0.0221  -0.9074  0.3642  -0.0633  0.0232
##
## ---
## Signif. codes:  0 '***' 0.001 '**' 0.01 '*' 0.05 '.' 0.1 ' ' 1
Meta-regression: secondary moderators
Age group
## [1] "Residual heterogeneity not significant (p>0.05)"Income setting
## [1] "Residual heterogeneity not significant (p>0.05)"Background immunogenicity (seroconversion rate in the control group)
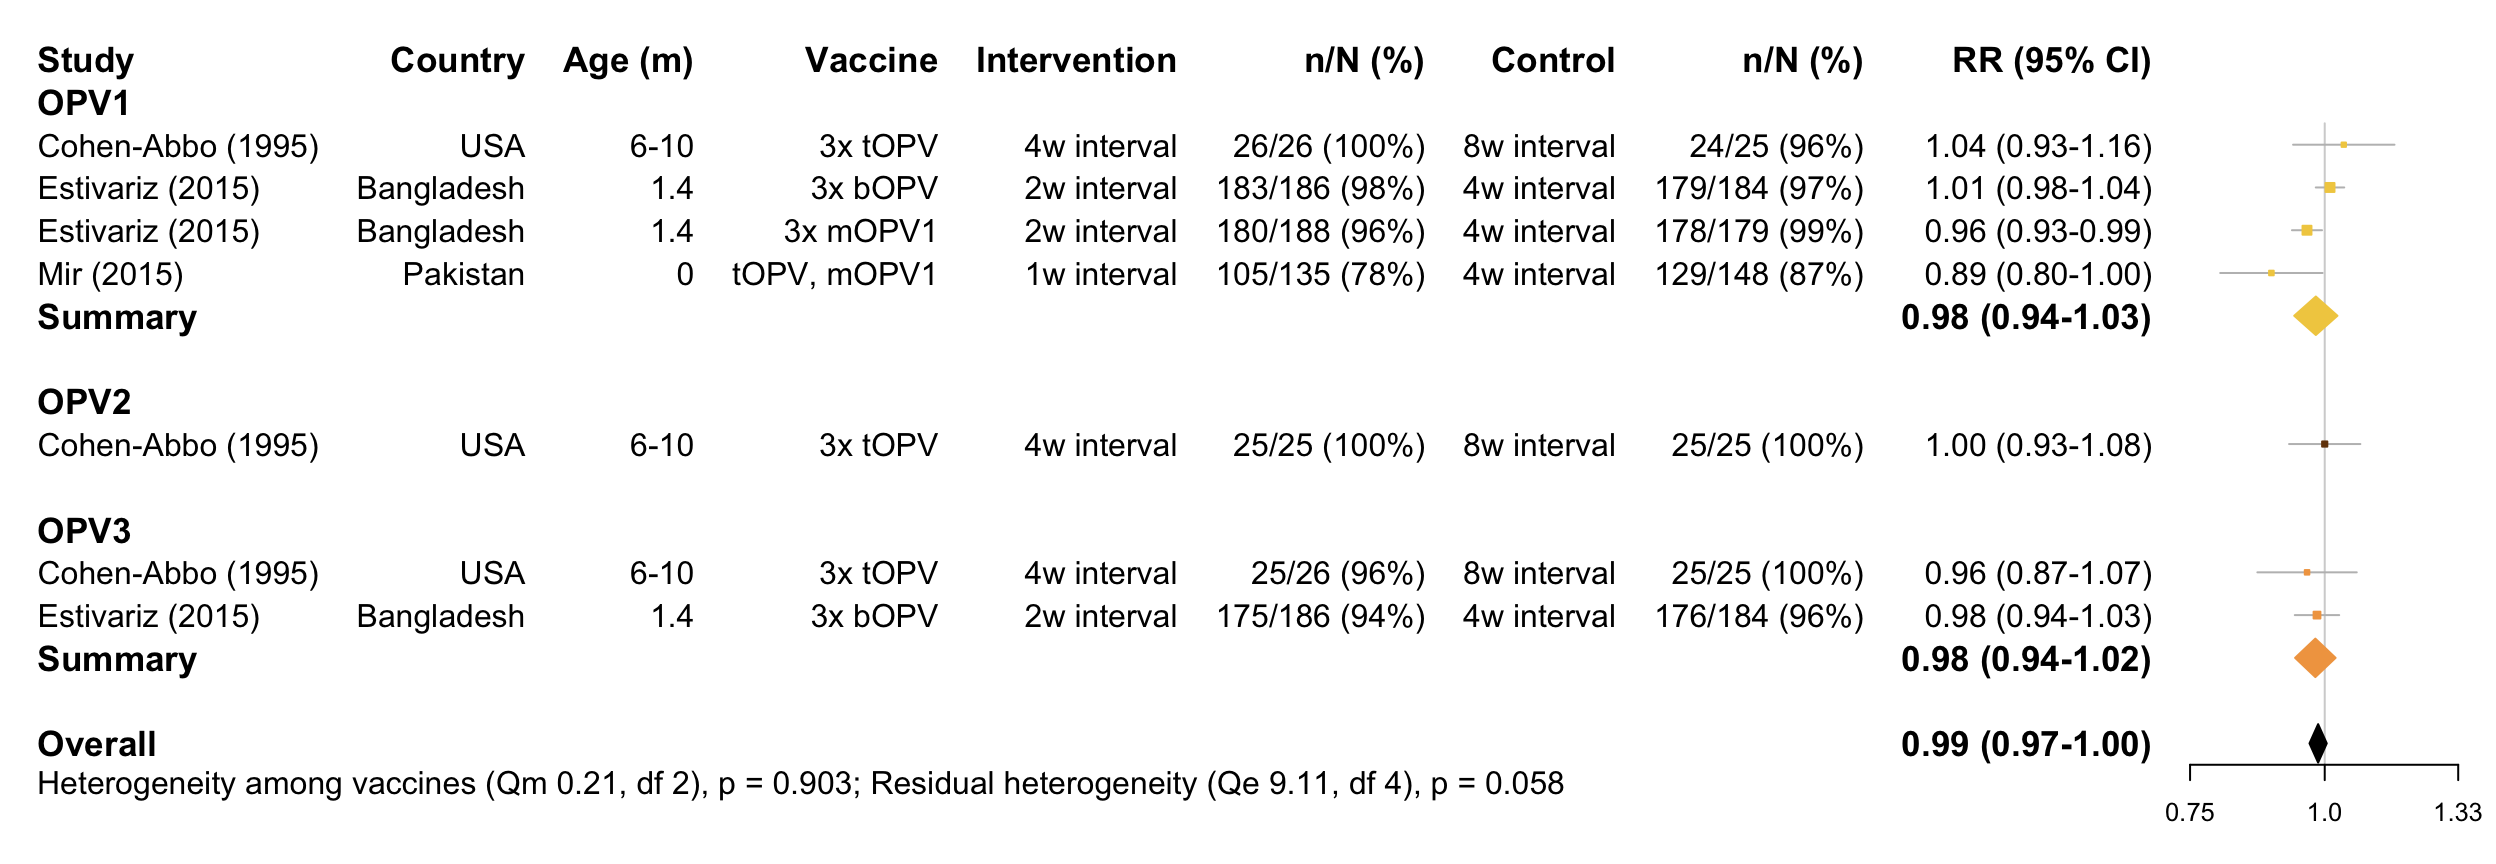
## [1] "Residual heterogeneity not significant (p>0.05)"OPV-specific analysis
Forest plot
Funnel plot
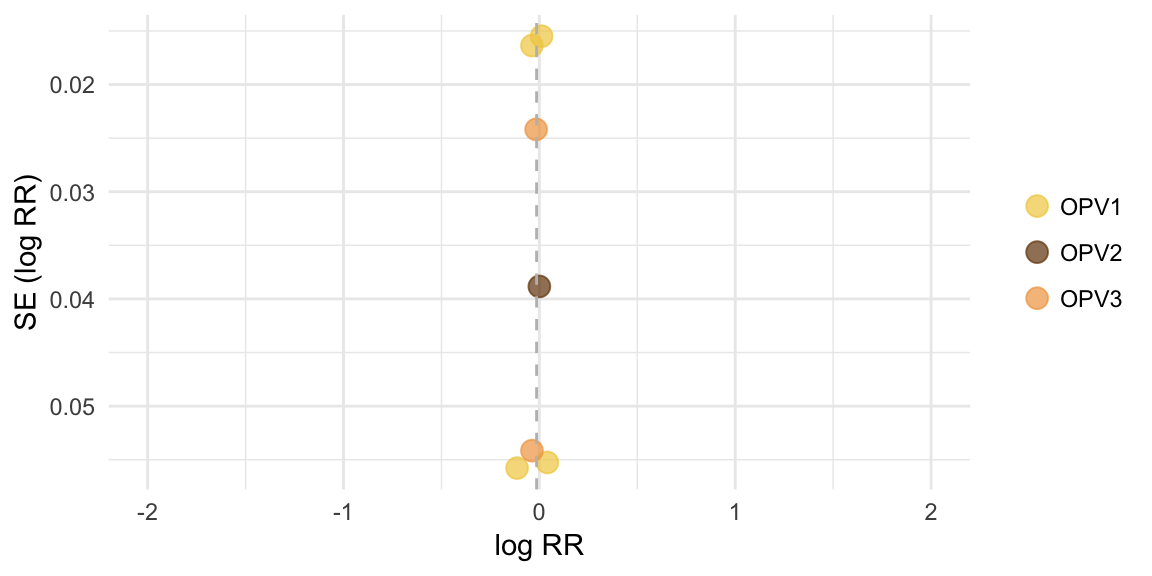
Egger’s test
Infants replicated across vaccines, therefore separate tests performed
## [1] "OPV1:"##
## Regression Test for Funnel Plot Asymmetry
##
## model: mixed-effects meta-regression model
## predictor: standard error
##
## test for funnel plot asymmetry: z = -0.3828, p = 0.7019## [1] "OPV2:"## [1] "Insufficient studies (n<3)"## [1] "OPV3:"## [1] "Insufficient studies (n<3)"Meta-analysis output
##
## Multivariate Meta-Analysis Model (k = 7; method: REML)
##
##   logLik  Deviance       AIC       BIC      AICc
##  10.0844  -20.1688  -16.1688  -16.5853  -12.1688
##
## Variance Components:
##
##             estim    sqrt  nlvls  fixed     factor
## sigma^2    0.0000  0.0000      3     no  Reference
##
## Test for Heterogeneity:
## Q(df = 6) = 9.3175, p-val = 0.1565
##
## Model Results:
##
## estimate      se     zval    pval    ci.lb   ci.ub
##  -0.0141  0.0094  -1.4960  0.1347  -0.0326  0.0044
##
## ---
## Signif. codes:  0 '***' 0.001 '**' 0.01 '*' 0.05 '.' 0.1 ' ' 1
Meta-regression output
##
## Multivariate Meta-Analysis Model (k = 7; method: REML)
##
## Variance Components:
##
##             estim    sqrt  nlvls  fixed     factor
## sigma^2    0.0000  0.0000      3     no  Reference
##
## Test for Residual Heterogeneity:
## QE(df = 4) = 9.1123, p-val = 0.0584
##
## Test of Moderators (coefficient(s) 2:3):
## QM(df = 2) = 0.2051, p-val = 0.9025
##
## Model Results:
##
##                         estimate      se     zval    pval    ci.lb   ci.ub
## intrcpt                  -0.0138  0.0108  -1.2727  0.2031  -0.0350  0.0074
## Measure_of_SCOPV2 N-AB    0.0138  0.0403   0.3414  0.7328  -0.0653  0.0928
## Measure_of_SCOPV3 N-AB   -0.0063  0.0246  -0.2552  0.7985  -0.0545  0.0419
##
## intrcpt
## Measure_of_SCOPV2 N-AB
## Measure_of_SCOPV3 N-AB
##
## ---
## Signif. codes:  0 '***' 0.001 '**' 0.01 '*' 0.05 '.' 0.1 ' ' 1
Serotype-specific outputs
Summary of PV1 studies
##
## Random-Effects Model (k = 4; tau^2 estimator: REML)
##
##   logLik  deviance       AIC       BIC      AICc
##   4.2597   -8.5193   -4.5193   -6.3221    7.4807
##
## tau^2 (estimated amount of total heterogeneity): 0.0012 (SE = 0.0018)
## tau (square root of estimated tau^2 value):      0.0353
## I^2 (total heterogeneity / total variability):   66.83%
## H^2 (total variability / sampling variability):  3.01
##
## Test for Heterogeneity:
## Q(df = 3) = 8.9842, p-val = 0.0295
##
## Model Results:
##
## estimate      se     zval    pval    ci.lb   ci.ub
##  -0.0190  0.0236  -0.8051  0.4208  -0.0652  0.0272
##
## ---
## Signif. codes:  0 '***' 0.001 '**' 0.01 '*' 0.05 '.' 0.1 ' ' 1
Summary of PV2 studies
## [1] "Insufficient studies (n<2)"Summary of PV3 studies
##
## Random-Effects Model (k = 2; tau^2 estimator: REML)
##
##   logLik  deviance       AIC       BIC      AICc
##   2.1885   -4.3771   -0.3771   -4.3771   11.6229
##
## tau^2 (estimated amount of total heterogeneity): 0 (SE = 0.0025)
## tau (square root of estimated tau^2 value):      0
## I^2 (total heterogeneity / total variability):   0.00%
## H^2 (total variability / sampling variability):  1.00
##
## Test for Heterogeneity:
## Q(df = 1) = 0.1281, p-val = 0.7204
##
## Model Results:
##
## estimate      se     zval    pval    ci.lb   ci.ub
##  -0.0200  0.0221  -0.9074  0.3642  -0.0633  0.0232
##
## ---
## Signif. codes:  0 '***' 0.001 '**' 0.01 '*' 0.05 '.' 0.1 ' ' 1