Extra dose(s)
Full analysis
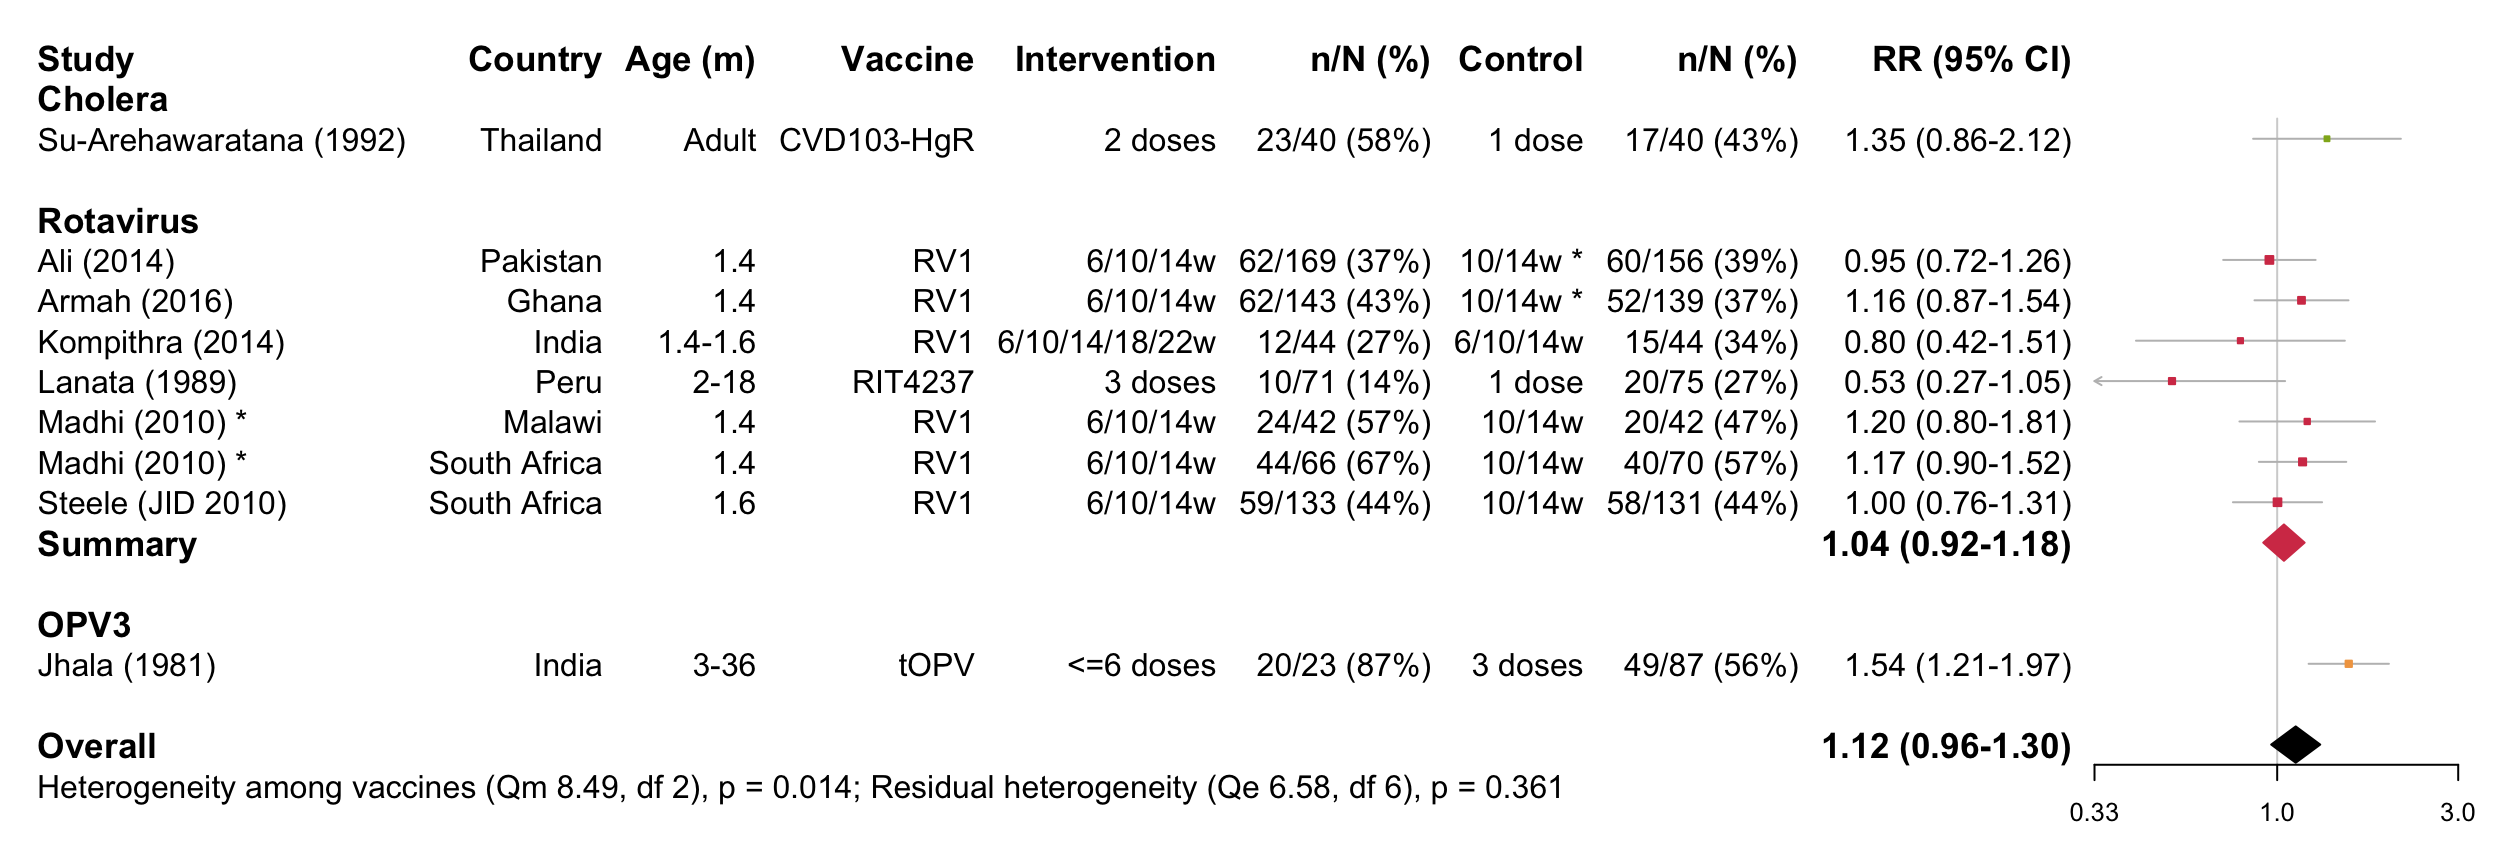
Forest plot
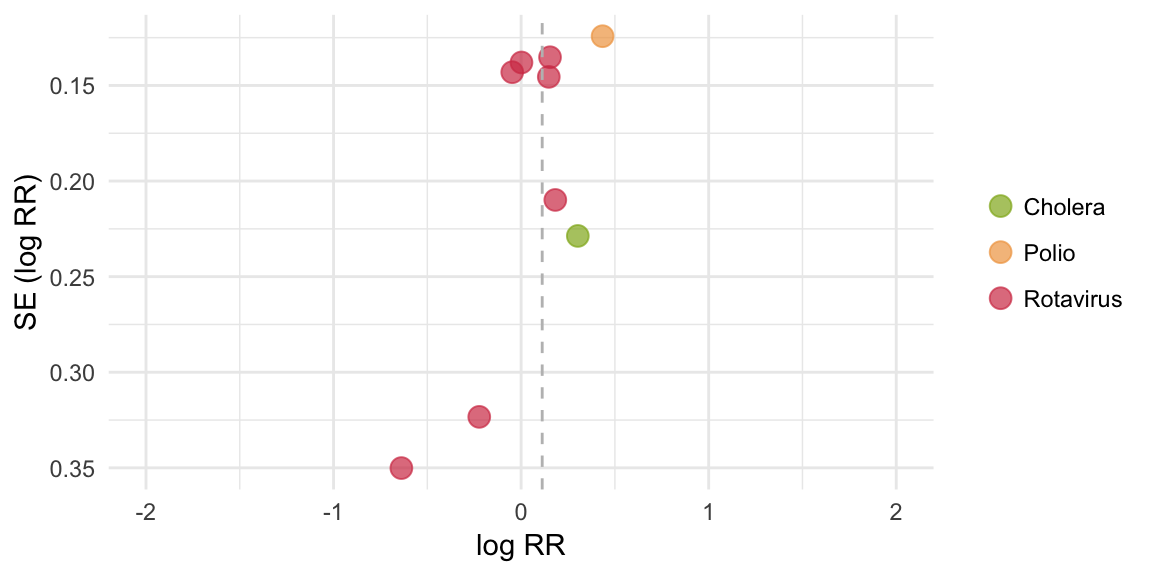
Funnel plot
Egger’s test
## [1] "Infants replicated across vaccines or vaccine effect significant, therefore separate tests performed"
## [1] "Cholera:"
## [1] "Insufficient studies (n<3)"
## [1] "Rotavirus:"
##
## Regression Test for Funnel Plot Asymmetry
##
## model:     mixed-effects meta-regression model
## predictor: standard error
##
## test for funnel plot asymmetry: z = -1.7034, p = 0.0885
##
## [1] "OPV3:"
## [1] "Insufficient studies (n<3)"
Meta-analysis output
##
## Random-Effects Model (k = 9; tau^2 estimator: REML)
##
##   logLik  deviance       AIC       BIC      AICc
##  -0.6935    1.3870    5.3870    5.5459    7.7870
##
## tau^2 (estimated amount of total heterogeneity): 0.0200 (SE = 0.0246)
## tau (square root of estimated tau^2 value):      0.1415
## I^2 (total heterogeneity / total variability):   41.19%
## H^2 (total variability / sampling variability):  1.70
##
## Test for Heterogeneity:
## Q(df = 8) = 15.0759, p-val = 0.0577
##
## Model Results:
##
## estimate      se    zval    pval    ci.lb   ci.ub
##   0.1125  0.0759  1.4809  0.1386  -0.0364  0.2613
##
## ---
## Signif. codes:  0 '***' 0.001 '**' 0.01 '*' 0.05 '.' 0.1 ' ' 1
Meta-regression output
##
## Mixed-Effects Model (k = 9; tau^2 estimator: REML)
##
## tau^2 (estimated amount of residual heterogeneity):     0.0000 (SE = 0.0152)
## tau (square root of estimated tau^2 value):             0.0011
## I^2 (residual heterogeneity / unaccounted variability): 0.00%
## H^2 (unaccounted variability / sampling variability):   1.00
## R^2 (amount of heterogeneity accounted for):            99.99%
##
## Test for Residual Heterogeneity:
## QE(df = 6) = 6.5822, p-val = 0.3612
##
## Test of Moderators (coefficient(s) 2:3):
## QM(df = 2) = 8.4932, p-val = 0.0143
##
## Model Results:
##
##                   estimate      se     zval    pval    ci.lb   ci.ub
## intrcpt             0.3023  0.2287   1.3217  0.1863  -0.1460  0.7505
## VaccinePolio        0.1320  0.2603   0.5073  0.6119  -0.3781  0.6422
## VaccineRotavirus   -0.2613  0.2375  -1.1002  0.2712  -0.7268  0.2042
##
## ---
## Signif. codes:  0 '***' 0.001 '**' 0.01 '*' 0.05 '.' 0.1 ' ' 1
Intervention-specific outputs
Summary of cholera studies
## [1] "Insufficient studies (n<2)"Summary of rotavirus studies
##
## Random-Effects Model (k = 7; tau^2 estimator: REML)
##
##   logLik  deviance       AIC       BIC      AICc
##   1.0133   -2.0266    1.9734    1.5569    5.9734
##
## tau^2 (estimated amount of total heterogeneity): 0.0000 (SE = 0.0152)
## tau (square root of estimated tau^2 value):      0.0011
## I^2 (total heterogeneity / total variability):   0.00%
## H^2 (total variability / sampling variability):  1.00
##
## Test for Heterogeneity:
## Q(df = 6) = 6.5822, p-val = 0.3612
##
## Model Results:
##
## estimate      se    zval    pval    ci.lb   ci.ub
##   0.0410  0.0641  0.6397  0.5224  -0.0846  0.1665
##
## ---
## Signif. codes:  0 '***' 0.001 '**' 0.01 '*' 0.05 '.' 0.1 ' ' 1
Summary of PV3 studies
## [1] "Insufficient studies (n<2)"Meta-regression: secondary moderators
Age group
## [1] "Residual heterogeneity not significant (p>0.05)"Income setting
## [1] "Residual heterogeneity not significant (p>0.05)"Background immunogenicity (seroconversion rate in the control group)
## [1] "Residual heterogeneity not significant (p>0.05)"OPV-specific analysis
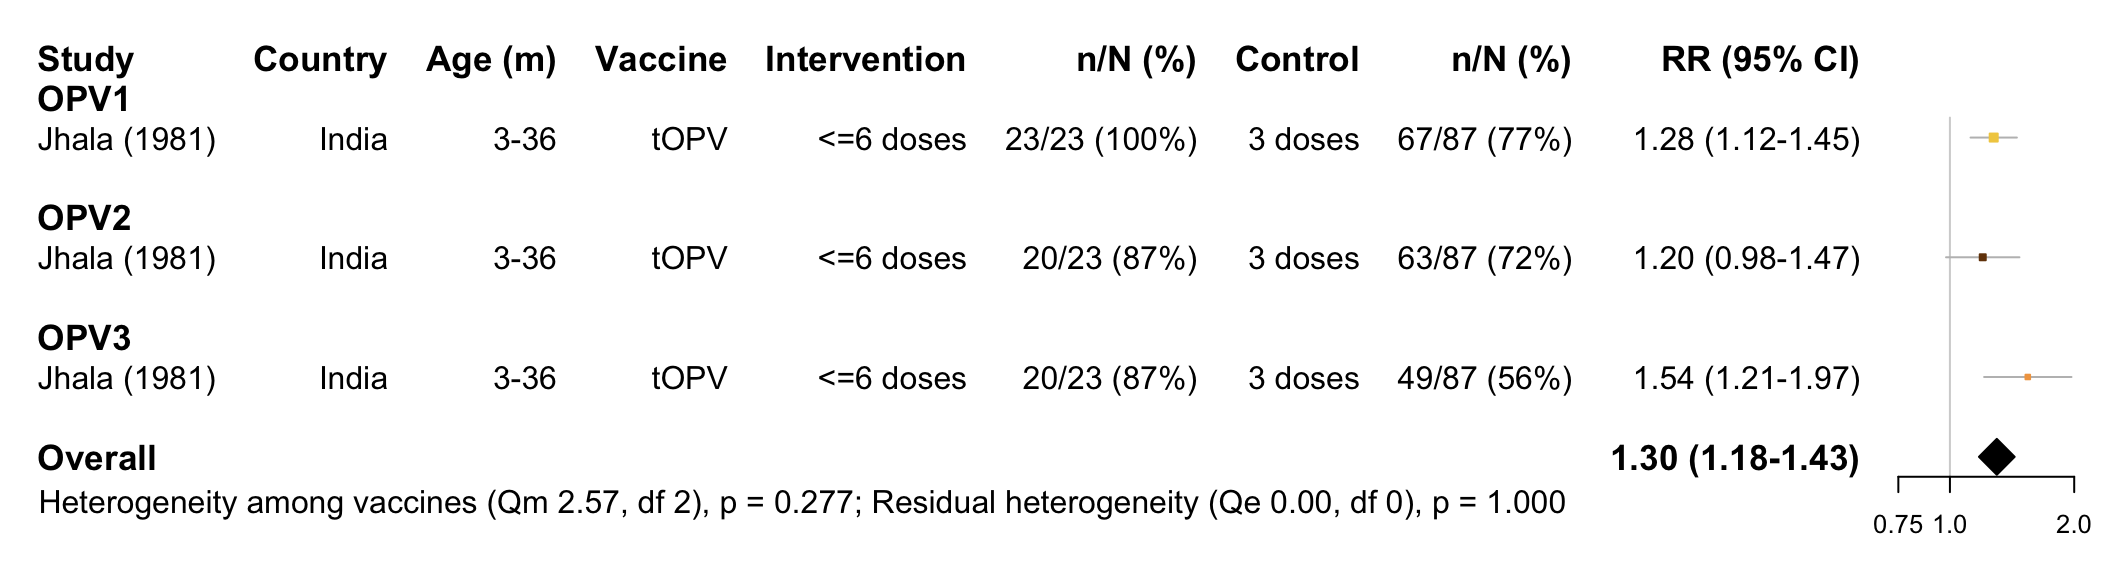
Forest plot
Funnel plot
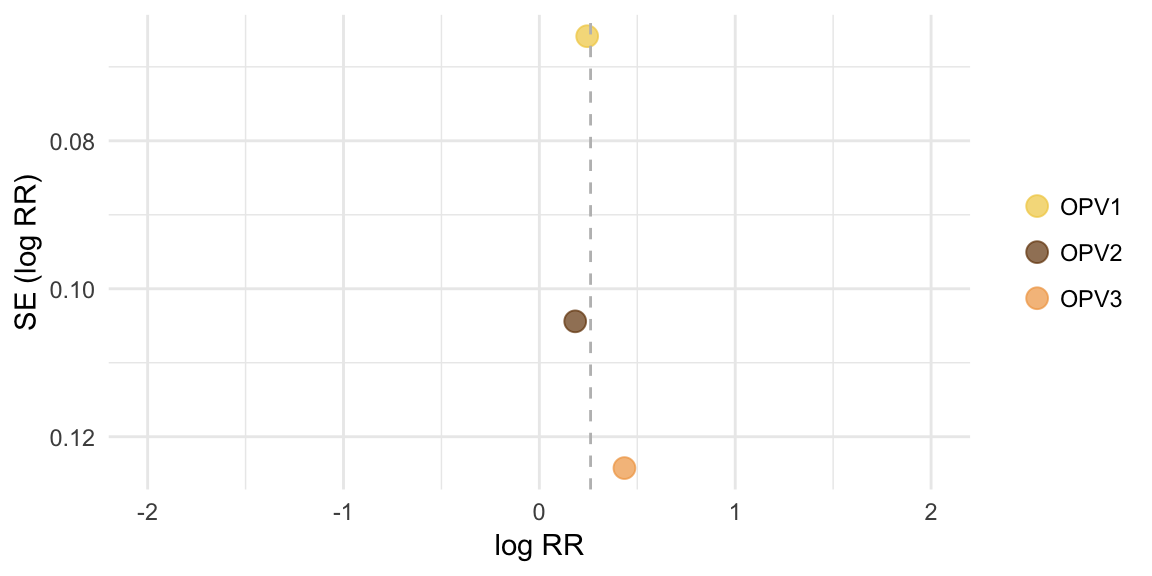
Egger’s test
Infants replicated across vaccines, therefore separate tests performed
## [1] "OPV1:"## [1] "Insufficient studies (n<3)"## [1] "OPV2:"## [1] "Insufficient studies (n<3)"## [1] "OPV3:"## [1] "Insufficient studies (n<3)"Meta-analysis output
##
## Multivariate Meta-Analysis Model (k = 3; method: REML)
##
##   logLik  Deviance       AIC       BIC      AICc
##   1.5126   -3.0252   -1.0252   -2.3320    2.9748
##
## Variance Components:
##
##             estim    sqrt  nlvls  fixed     factor
## sigma^2    0.0000  0.0000      1    yes  Reference
##
## Test for Heterogeneity:
## Q(df = 2) = 2.5696, p-val = 0.2767
##
## Model Results:
##
## estimate      se    zval    pval   ci.lb   ci.ub
##   0.2615  0.0508  5.1446  <.0001  0.1619  0.3611  ***
##
## ---
## Signif. codes:  0 '***' 0.001 '**' 0.01 '*' 0.05 '.' 0.1 ' ' 1
Meta-regression output
##
## Multivariate Meta-Analysis Model (k = 3; method: REML)
##
## Variance Components:
##
##             estim    sqrt  nlvls  fixed     factor
## sigma^2    0.0000  0.0000      1    yes  Reference
##
## Test for Residual Heterogeneity:
## QE(df = 0) = 0.0000, p-val = 1.0000
##
## Test of Moderators (coefficient(s) 2:3):
## QM(df = 2) = 2.5696, p-val = 0.2767
##
## Model Results:
##
##                         estimate      se     zval    pval    ci.lb   ci.ub
## intrcpt                   0.2442  0.0659   3.7071  0.0002   0.1151  0.3732
## Measure_of_SCOPV2 N-AB   -0.0611  0.1234  -0.4953  0.6204  -0.3031  0.1808
## Measure_of_SCOPV3 N-AB    0.1902  0.1406   1.3524  0.1763  -0.0854  0.4658
##
## intrcpt                 ***
## Measure_of_SCOPV2 N-AB
## Measure_of_SCOPV3 N-AB
##
## ---
## Signif. codes:  0 '***' 0.001 '**' 0.01 '*' 0.05 '.' 0.1 ' ' 1
Serotype-specific outputs
Summary of PV1 studies
## [1] "Insufficient studies (n<2)"Summary of PV2 studies
## [1] "Insufficient studies (n<2)"Summary of PV3 studies
## [1] "Insufficient studies (n<2)"