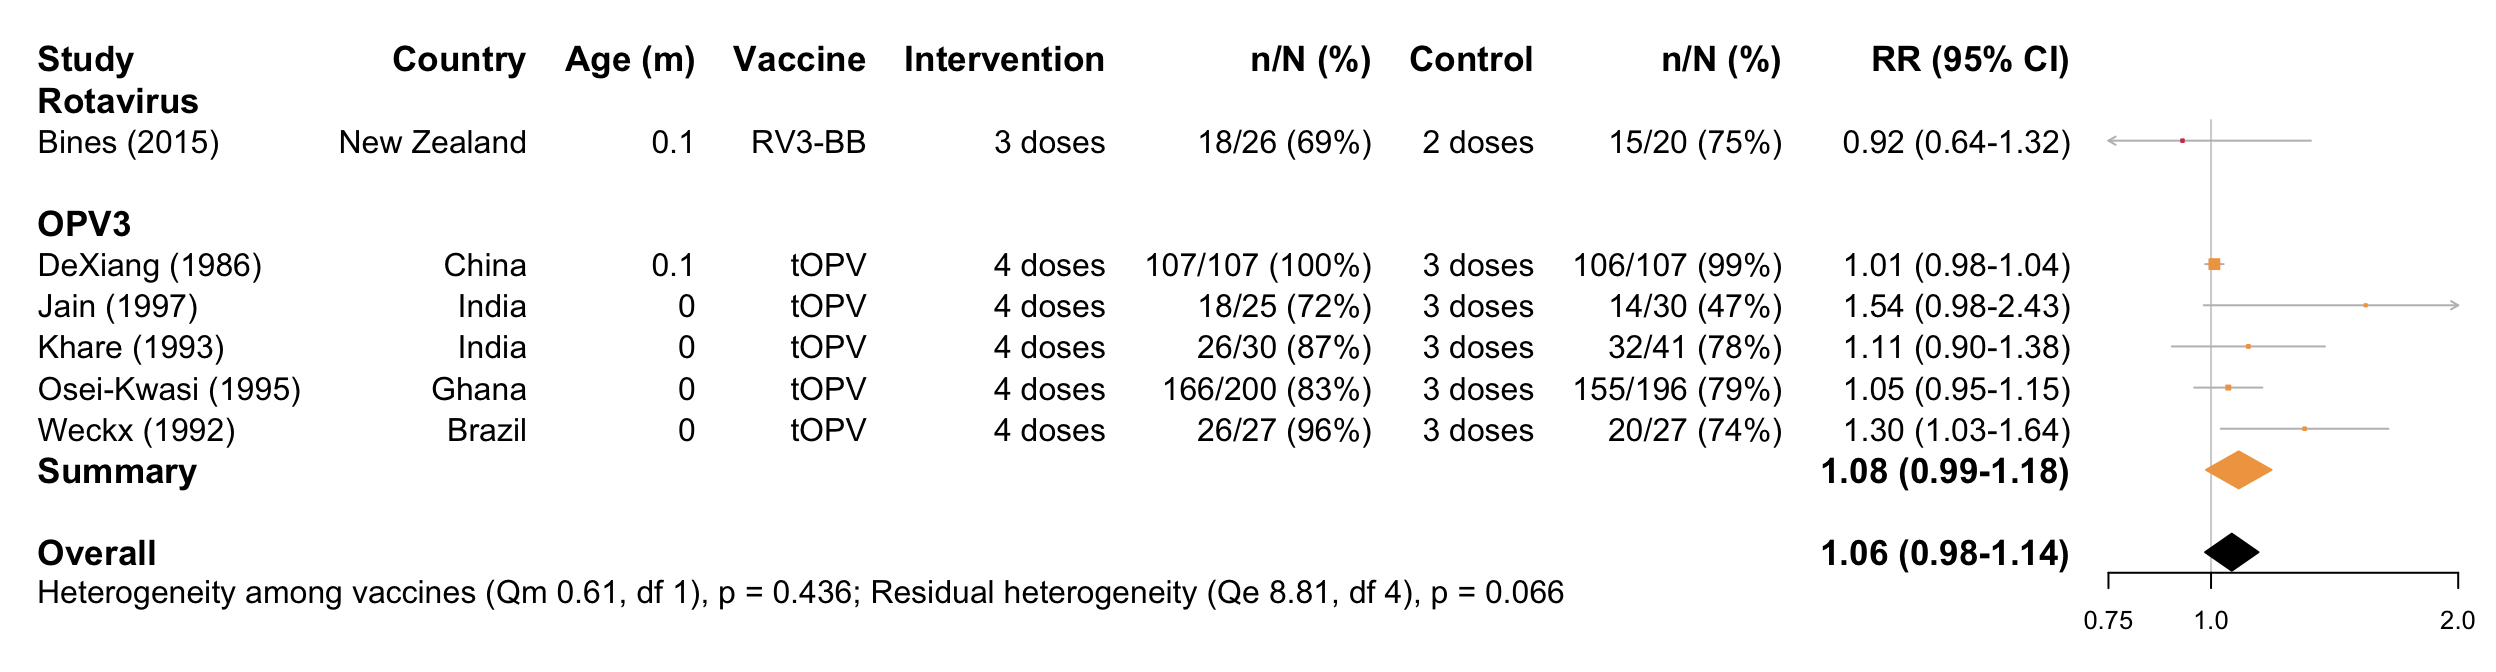
Extra dose at birth
Full analysis
Forest plot
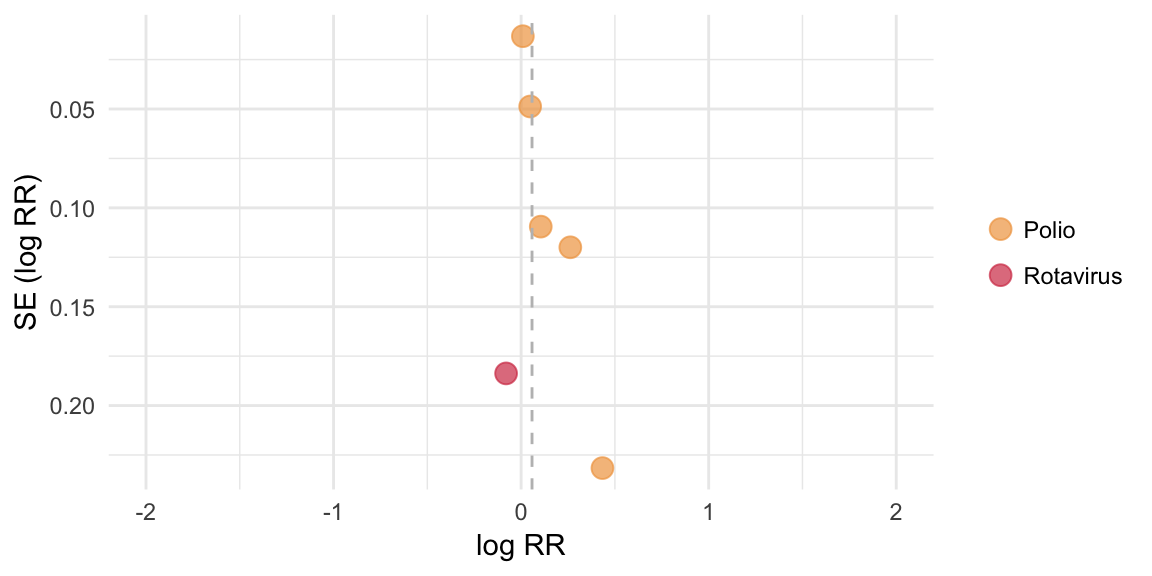
Funnel plot
Egger’s test
## [1] "No replication of infants across vaccines or significant vaccine effect, therefore combined test performed"##
## Regression Test for Funnel Plot Asymmetry
##
## model: mixed-effects meta-regression model
## predictor: standard error
##
## test for funnel plot asymmetry: z = 2.2168, p = 0.0266Meta-analysis output
##
## Random-Effects Model (k = 6; tau^2 estimator: REML)
##
##   logLik  deviance       AIC       BIC      AICc
##   2.5907   -5.1813   -1.1813   -1.9624    4.8187
##
## tau^2 (estimated amount of total heterogeneity): 0.0029 (SE = 0.0051)
## tau (square root of estimated tau^2 value):      0.0538
## I^2 (total heterogeneity / total variability):   40.02%
## H^2 (total variability / sampling variability):  1.67
##
## Test for Heterogeneity:
## Q(df = 5) = 9.0926, p-val = 0.1054
##
## Model Results:
##
## estimate      se    zval    pval    ci.lb   ci.ub
##   0.0582  0.0382  1.5247  0.1273  -0.0166  0.1330
##
## ---
## Signif. codes:  0 '***' 0.001 '**' 0.01 '*' 0.05 '.' 0.1 ' ' 1
Meta-regression output
##
## Mixed-Effects Model (k = 6; tau^2 estimator: REML)
##
## tau^2 (estimated amount of residual heterogeneity):     0.0050 (SE = 0.0074)
## tau (square root of estimated tau^2 value):             0.0708
## I^2 (residual heterogeneity / unaccounted variability): 57.99%
## H^2 (unaccounted variability / sampling variability):   2.38
## R^2 (amount of heterogeneity accounted for):            0.00%
##
## Test for Residual Heterogeneity:
## QE(df = 4) = 8.8138, p-val = 0.0659
##
## Test of Moderators (coefficient(s) 2):
## QM(df = 1) = 0.6079, p-val = 0.4356
##
## Model Results:
##
##                   estimate      se     zval    pval    ci.lb   ci.ub
## intrcpt             0.0778  0.0469   1.6597  0.0970  -0.0141  0.1696  .
## VaccineRotavirus   -0.1578  0.2024  -0.7797  0.4356  -0.5546  0.2389
##
## ---
## Signif. codes:  0 '***' 0.001 '**' 0.01 '*' 0.05 '.' 0.1 ' ' 1
Intervention-specific outputs
Summary of cholera studies
## [1] "Insufficient studies (n<2)"Summary of rotavirus studies
## [1] "Insufficient studies (n<2)"Summary of PV3 studies
##
## Random-Effects Model (k = 5; tau^2 estimator: REML)
##
##   logLik  deviance       AIC       BIC      AICc
##   2.0906   -4.1812   -0.1812   -1.4087   11.8188
##
## tau^2 (estimated amount of total heterogeneity): 0.0050 (SE = 0.0074)
## tau (square root of estimated tau^2 value):      0.0708
## I^2 (total heterogeneity / total variability):   57.99%
## H^2 (total variability / sampling variability):  2.38
##
## Test for Heterogeneity:
## Q(df = 4) = 8.8138, p-val = 0.0659
##
## Model Results:
##
## estimate      se    zval    pval    ci.lb   ci.ub
##   0.0778  0.0469  1.6597  0.0970  -0.0141  0.1696  .
##
## ---
## Signif. codes:  0 '***' 0.001 '**' 0.01 '*' 0.05 '.' 0.1 ' ' 1
Meta-regression: secondary moderators
Age group
## [1] "Residual heterogeneity not significant (p>0.05)"Income setting
## [1] "Residual heterogeneity not significant (p>0.05)"Background immunogenicity (seroconversion rate in the control group)
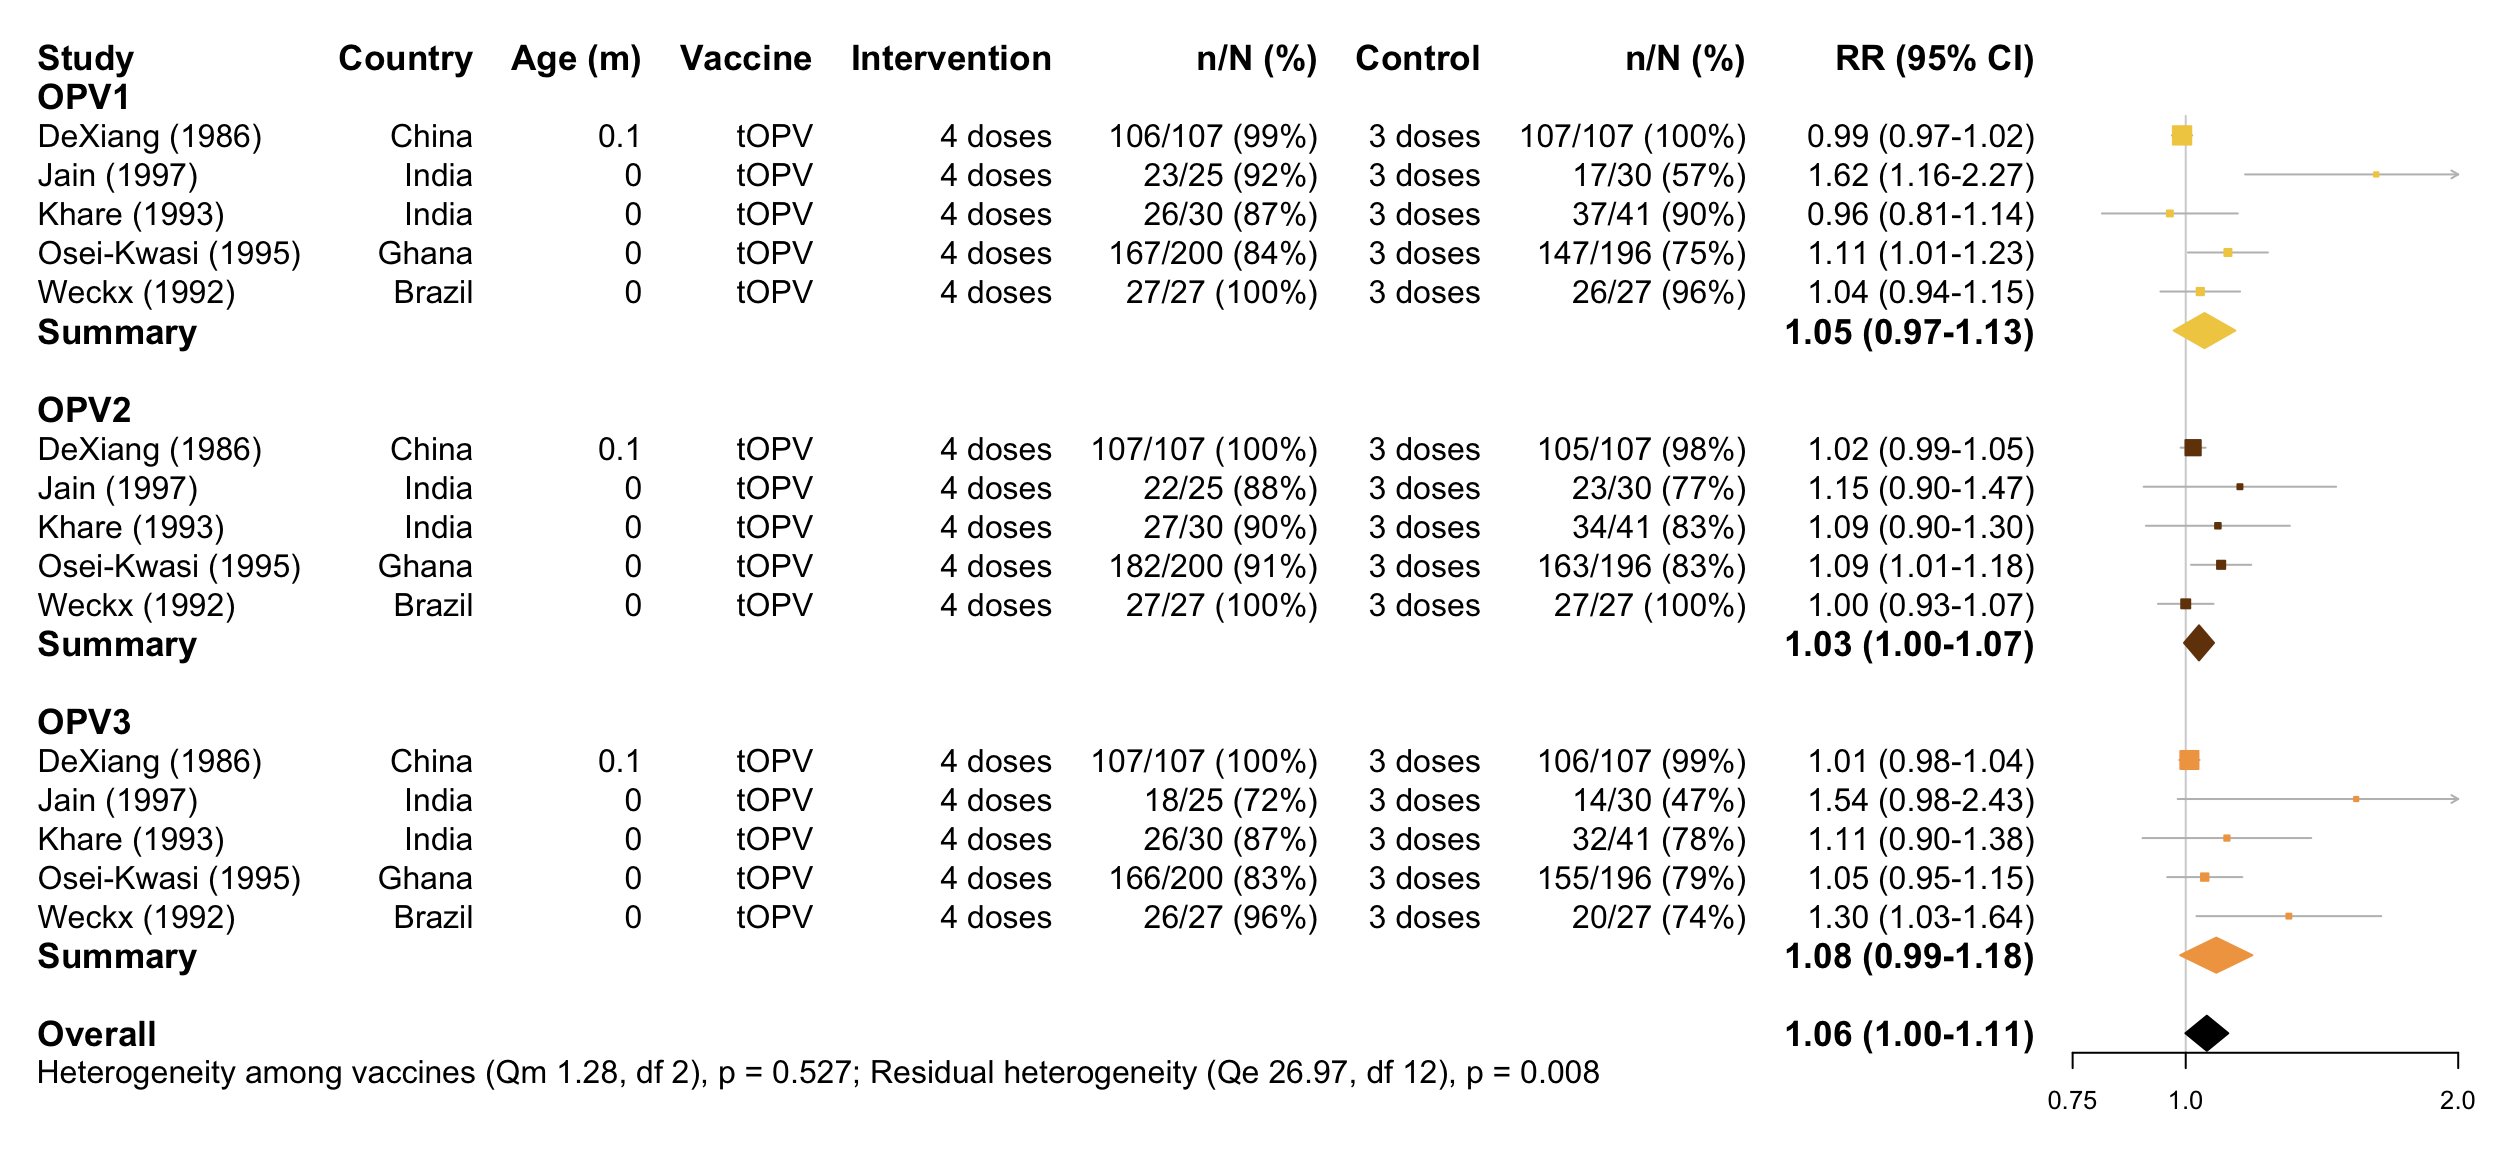
## [1] "Residual heterogeneity not significant (p>0.05)"OPV-specific analysis
Forest plot
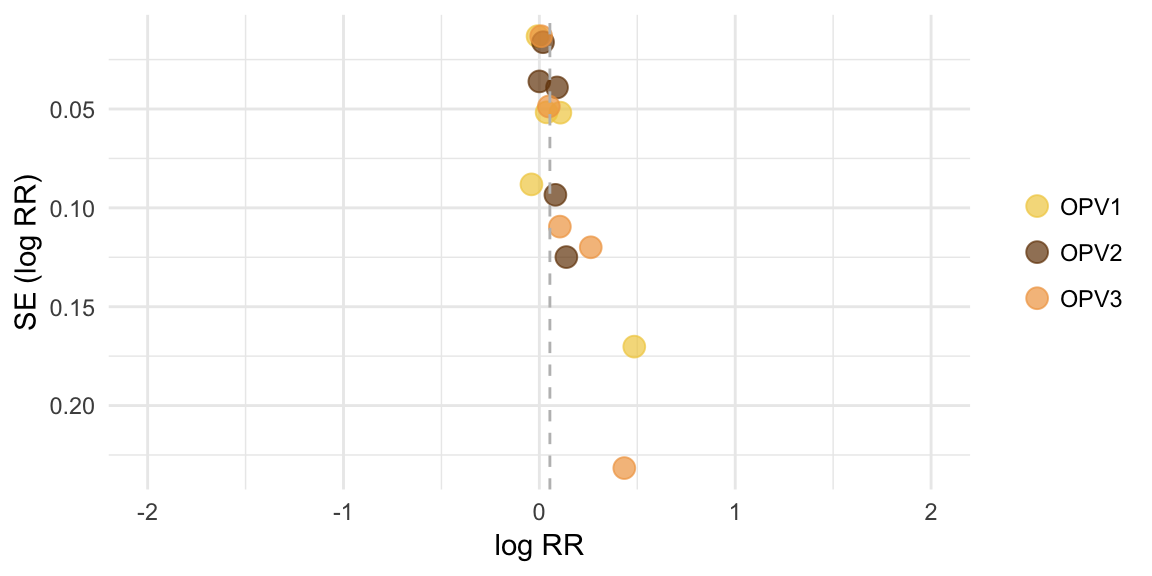
Funnel plot
Egger’s test
Infants replicated across vaccines, therefore separate tests performed
## [1] "OPV1:"##
## Regression Test for Funnel Plot Asymmetry
##
## model: mixed-effects meta-regression model
## predictor: standard error
##
## test for funnel plot asymmetry: z = 2.5674, p = 0.0102## [1] "OPV2:"##
## Regression Test for Funnel Plot Asymmetry
##
## model: mixed-effects meta-regression model
## predictor: standard error
##
## test for funnel plot asymmetry: z = 1.3033, p = 0.1925## [1] "OPV3:"##
## Regression Test for Funnel Plot Asymmetry
##
## model: mixed-effects meta-regression model
## predictor: standard error
##
## test for funnel plot asymmetry: z = 2.7995, p = 0.0051Meta-analysis output
##
## Multivariate Meta-Analysis Model (k = 15; method: REML)
##
##   logLik  Deviance       AIC       BIC      AICc
##  14.8397  -29.6795  -25.6795  -24.4014  -24.5886
##
## Variance Components:
##
##             estim    sqrt  nlvls  fixed     factor
## sigma^2    0.0025  0.0496      5     no  Reference
##
## Test for Heterogeneity:
## Q(df = 14) = 29.0169, p-val = 0.0104
##
## Model Results:
##
## estimate      se    zval    pval    ci.lb   ci.ub
##   0.0537  0.0278  1.9302  0.0536  -0.0008  0.1083  .
##
## ---
## Signif. codes:  0 '***' 0.001 '**' 0.01 '*' 0.05 '.' 0.1 ' ' 1
Meta-regression output
##
## Multivariate Meta-Analysis Model (k = 15; method: REML)
##
## Variance Components:
##
##             estim    sqrt  nlvls  fixed     factor
## sigma^2    0.0023  0.0480      5     no  Reference
##
## Test for Residual Heterogeneity:
## QE(df = 12) = 26.9688, p-val = 0.0078
##
## Test of Moderators (coefficient(s) 2:3):
## QM(df = 2) = 1.2812, p-val = 0.5270
##
## Model Results:
##
##                         estimate      se    zval    pval    ci.lb   ci.ub
## intrcpt                   0.0411  0.0292  1.4100  0.1585  -0.0160  0.0983
## Measure_of_SCOPV2 N-AB    0.0184  0.0186  0.9921  0.3211  -0.0180  0.0548
## Measure_of_SCOPV3 N-AB    0.0164  0.0176  0.9330  0.3508  -0.0180  0.0508
##
## intrcpt
## Measure_of_SCOPV2 N-AB
## Measure_of_SCOPV3 N-AB
##
## ---
## Signif. codes:  0 '***' 0.001 '**' 0.01 '*' 0.05 '.' 0.1 ' ' 1
Serotype-specific outputs
Summary of PV1 studies
##
## Random-Effects Model (k = 5; tau^2 estimator: REML)
##
##   logLik  deviance       AIC       BIC      AICc
##   1.6742   -3.3483    0.6517   -0.5757   12.6517
##
## tau^2 (estimated amount of total heterogeneity): 0.0043 (SE = 0.0055)
## tau (square root of estimated tau^2 value):      0.0656
## I^2 (total heterogeneity / total variability):   63.97%
## H^2 (total variability / sampling variability):  2.78
##
## Test for Heterogeneity:
## Q(df = 4) = 13.6018, p-val = 0.0087
##
## Model Results:
##
## estimate      se    zval    pval    ci.lb   ci.ub
##   0.0478  0.0401  1.1939  0.2325  -0.0307  0.1264
##
## ---
## Signif. codes:  0 '***' 0.001 '**' 0.01 '*' 0.05 '.' 0.1 ' ' 1
Summary of PV2 studies
##
## Random-Effects Model (k = 5; tau^2 estimator: REML)
##
##   logLik  deviance       AIC       BIC      AICc
##   5.7615  -11.5230   -7.5230   -8.7504    4.4770
##
## tau^2 (estimated amount of total heterogeneity): 0.0005 (SE = 0.0013)
## tau (square root of estimated tau^2 value):      0.0214
## I^2 (total heterogeneity / total variability):   22.52%
## H^2 (total variability / sampling variability):  1.29
##
## Test for Heterogeneity:
## Q(df = 4) = 4.5533, p-val = 0.3363
##
## Model Results:
##
## estimate      se    zval    pval    ci.lb   ci.ub
##   0.0338  0.0195  1.7334  0.0830  -0.0044  0.0720  .
##
## ---
## Signif. codes:  0 '***' 0.001 '**' 0.01 '*' 0.05 '.' 0.1 ' ' 1
Summary of PV3 studies
##
## Random-Effects Model (k = 5; tau^2 estimator: REML)
##
##   logLik  deviance       AIC       BIC      AICc
##   2.0906   -4.1812   -0.1812   -1.4087   11.8188
##
## tau^2 (estimated amount of total heterogeneity): 0.0050 (SE = 0.0074)
## tau (square root of estimated tau^2 value):      0.0708
## I^2 (total heterogeneity / total variability):   57.99%
## H^2 (total variability / sampling variability):  2.38
##
## Test for Heterogeneity:
## Q(df = 4) = 8.8138, p-val = 0.0659
##
## Model Results:
##
## estimate      se    zval    pval    ci.lb   ci.ub
##   0.0778  0.0469  1.6597  0.0970  -0.0141  0.1696  .
##
## ---
## Signif. codes:  0 '***' 0.001 '**' 0.01 '*' 0.05 '.' 0.1 ' ' 1