Probiotic
Full analysis
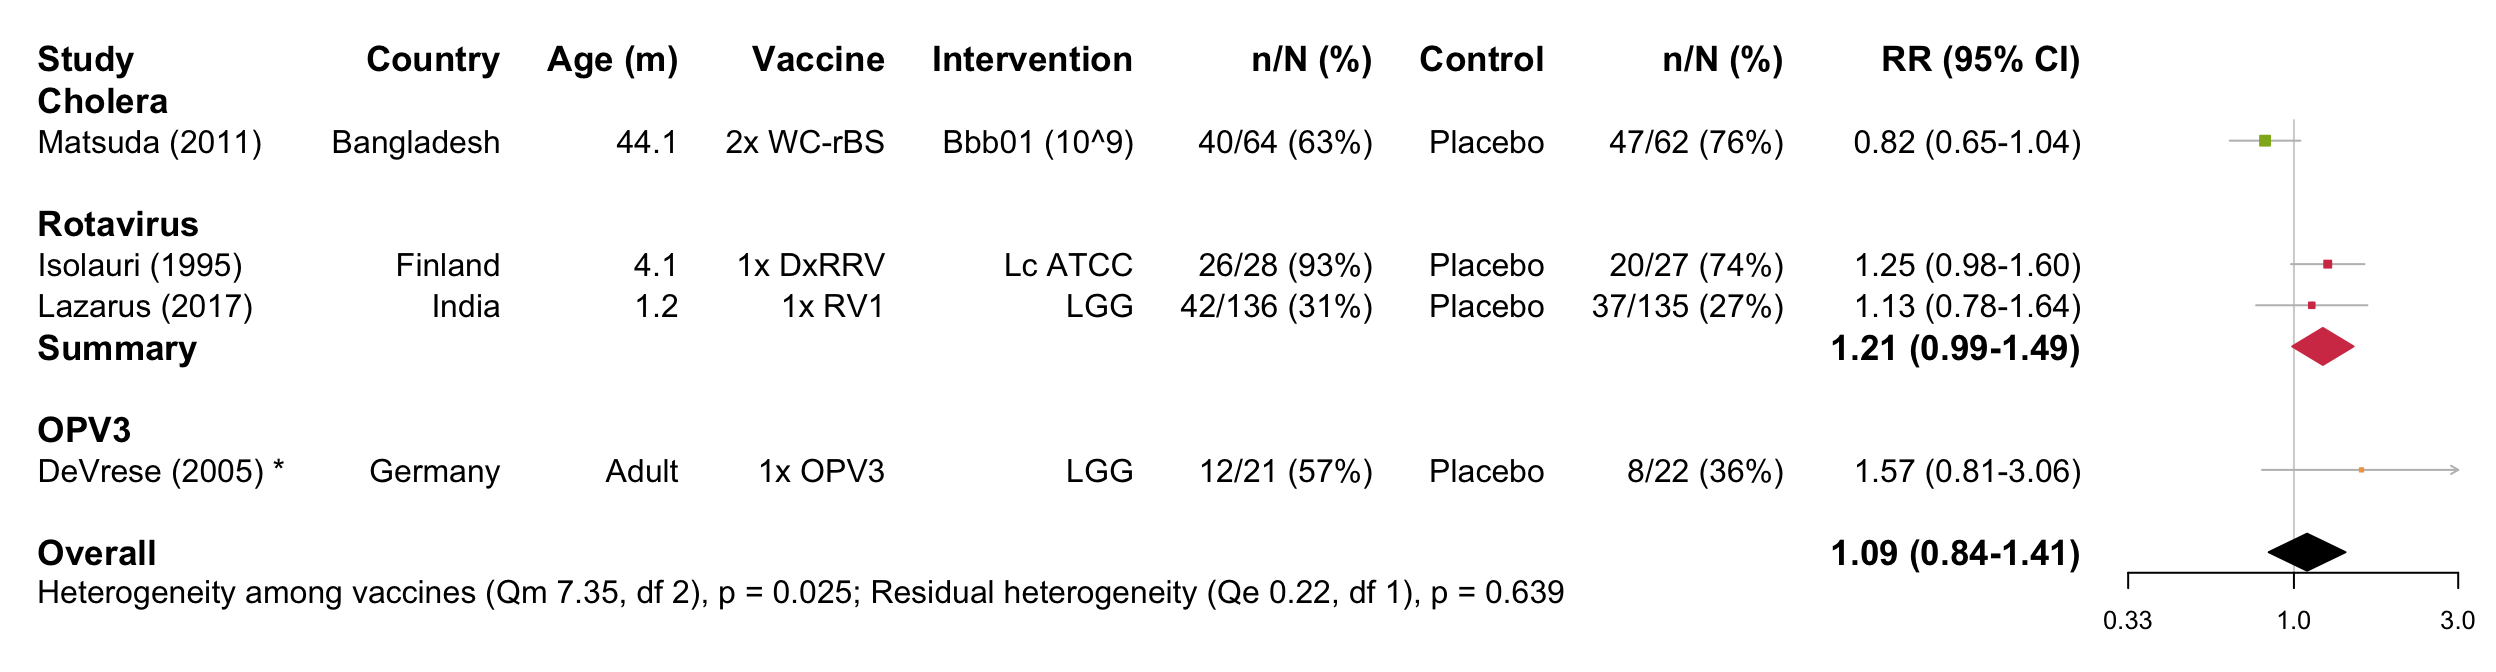
Forest plot
Funnel plot
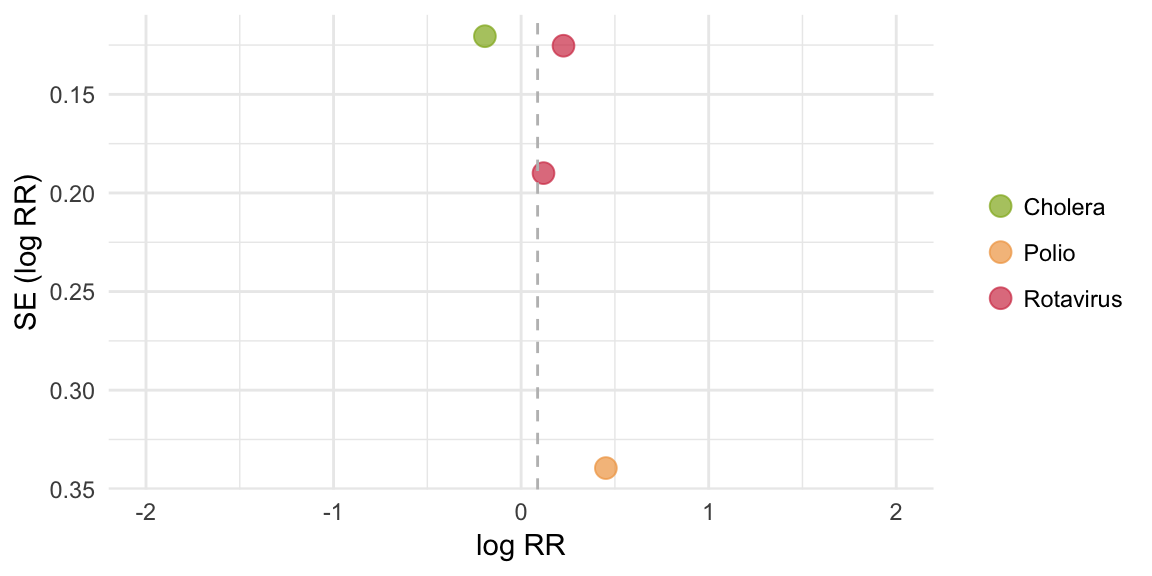
Egger’s test
## [1] "Infants replicated across vaccines or vaccine effect significant, therefore separate tests performed"
## [1] "Cholera:"
## [1] "Insufficient studies (n<3)"
## [1] "Rotavirus:"
## [1] "Insufficient studies (n<3)"
## [1] "OPV3:"
## [1] "Insufficient studies (n<3)"
Meta-analysis output
##
## Random-Effects Model (k = 4; tau^2 estimator: REML)
##
##   logLik  deviance       AIC       BIC      AICc
##  -0.2845    0.5691    4.5691    2.7663   16.5691
##
## tau^2 (estimated amount of total heterogeneity): 0.0374 (SE = 0.0555)
## tau (square root of estimated tau^2 value):      0.1935
## I^2 (total heterogeneity / total variability):   58.26%
## H^2 (total variability / sampling variability):  2.40
##
## Test for Heterogeneity:
## Q(df = 3) = 7.5735, p-val = 0.0557
##
## Model Results:
##
## estimate      se    zval    pval    ci.lb   ci.ub
##   0.0880  0.1311  0.6712  0.5021  -0.1689  0.3449
##
## ---
## Signif. codes:  0 '***' 0.001 '**' 0.01 '*' 0.05 '.' 0.1 ' ' 1
Meta-regression output
##
## Mixed-Effects Model (k = 4; tau^2 estimator: REML)
##
## tau^2 (estimated amount of residual heterogeneity):     0 (SE = 0.0366)
## tau (square root of estimated tau^2 value):             0
## I^2 (residual heterogeneity / unaccounted variability): 0.00%
## H^2 (unaccounted variability / sampling variability):   1.00
## R^2 (amount of heterogeneity accounted for):            100.00%
##
## Test for Residual Heterogeneity:
## QE(df = 1) = 0.2195, p-val = 0.6394
##
## Test of Moderators (coefficient(s) 2:3):
## QM(df = 2) = 7.3540, p-val = 0.0253
##
## Model Results:
##
##                   estimate      se     zval    pval    ci.lb   ci.ub
## intrcpt            -0.1930  0.1205  -1.6017  0.1092  -0.4292  0.0432
## VaccinePolio        0.6450  0.3603   1.7904  0.0734  -0.0611  1.3511  .
## VaccineRotavirus    0.3867  0.1596   2.4230  0.0154   0.0739  0.6994  *
##
## ---
## Signif. codes:  0 '***' 0.001 '**' 0.01 '*' 0.05 '.' 0.1 ' ' 1
Intervention-specific outputs
Summary of cholera studies
## [1] "Insufficient studies (n<2)"Summary of rotavirus studies
##
## Random-Effects Model (k = 2; tau^2 estimator: REML)
##
##   logLik  deviance       AIC       BIC      AICc
##   0.7982   -1.5964    2.4036   -1.5964   14.4036
##
## tau^2 (estimated amount of total heterogeneity): 0 (SE = 0.0366)
## tau (square root of estimated tau^2 value):      0
## I^2 (total heterogeneity / total variability):   0.00%
## H^2 (total variability / sampling variability):  1.00
##
## Test for Heterogeneity:
## Q(df = 1) = 0.2195, p-val = 0.6394
##
## Model Results:
##
## estimate      se    zval    pval    ci.lb   ci.ub
##   0.1937  0.1046  1.8511  0.0642  -0.0114  0.3987  .
##
## ---
## Signif. codes:  0 '***' 0.001 '**' 0.01 '*' 0.05 '.' 0.1 ' ' 1
Summary of PV3 studies
## [1] "Insufficient studies (n<2)"Meta-regression: secondary moderators
Age group
## [1] "Residual heterogeneity not significant (p>0.05)"Income setting
## [1] "Residual heterogeneity not significant (p>0.05)"Background immunogenicity (seroconversion rate in the control group)
## [1] "Residual heterogeneity not significant (p>0.05)"OPV-specific analysis
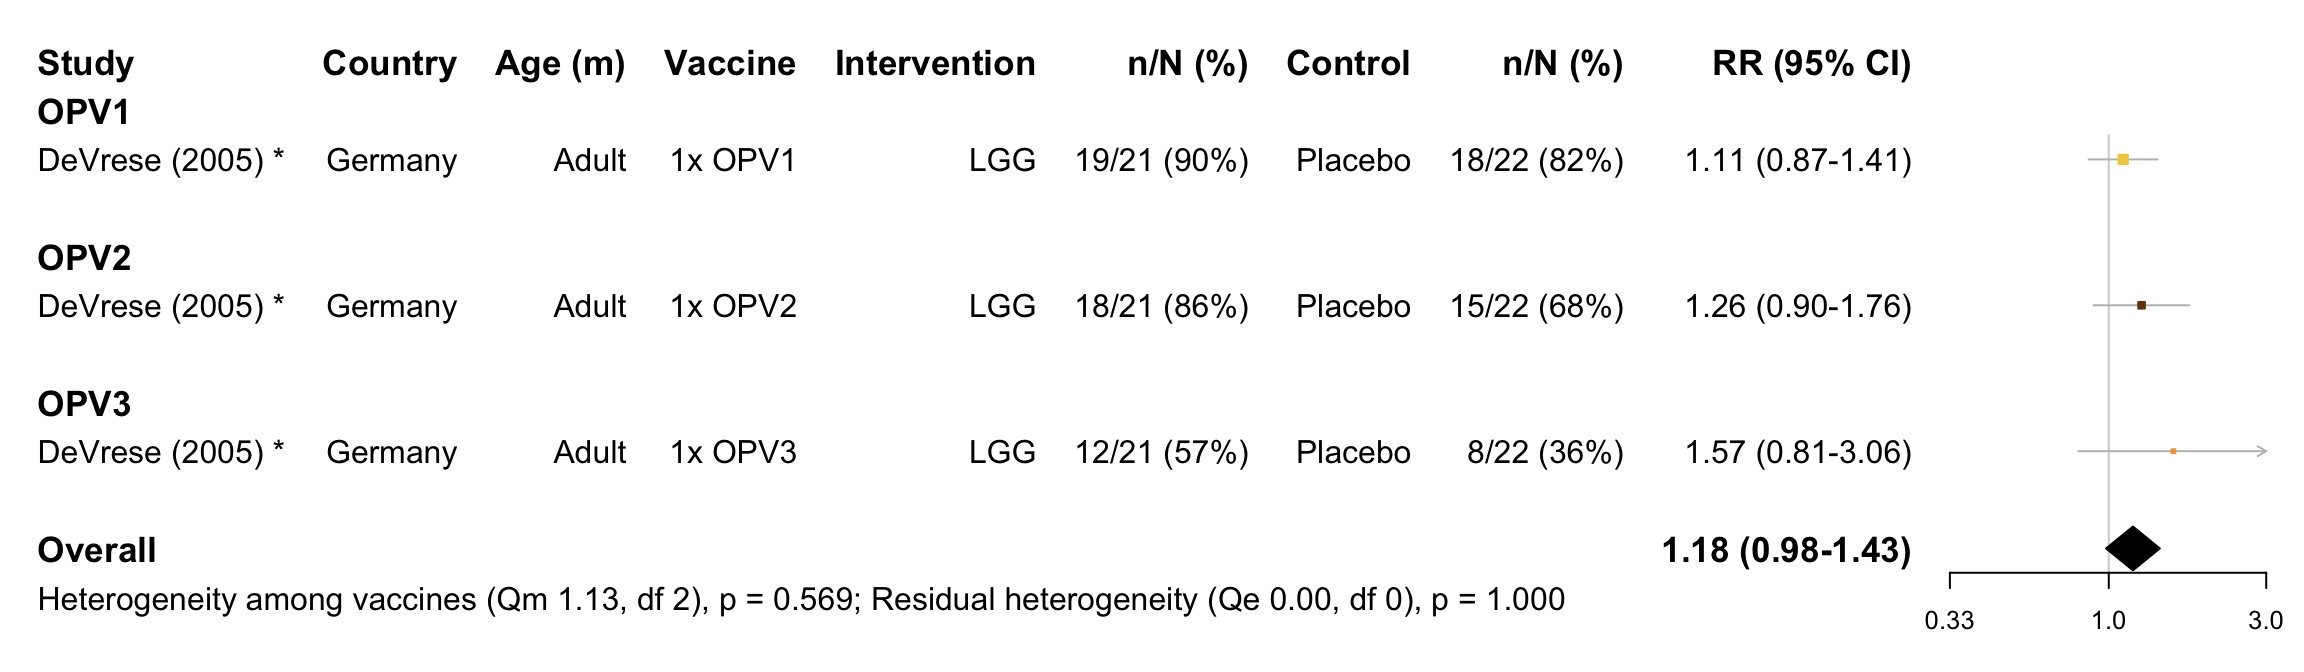
Forest plot
Funnel plot
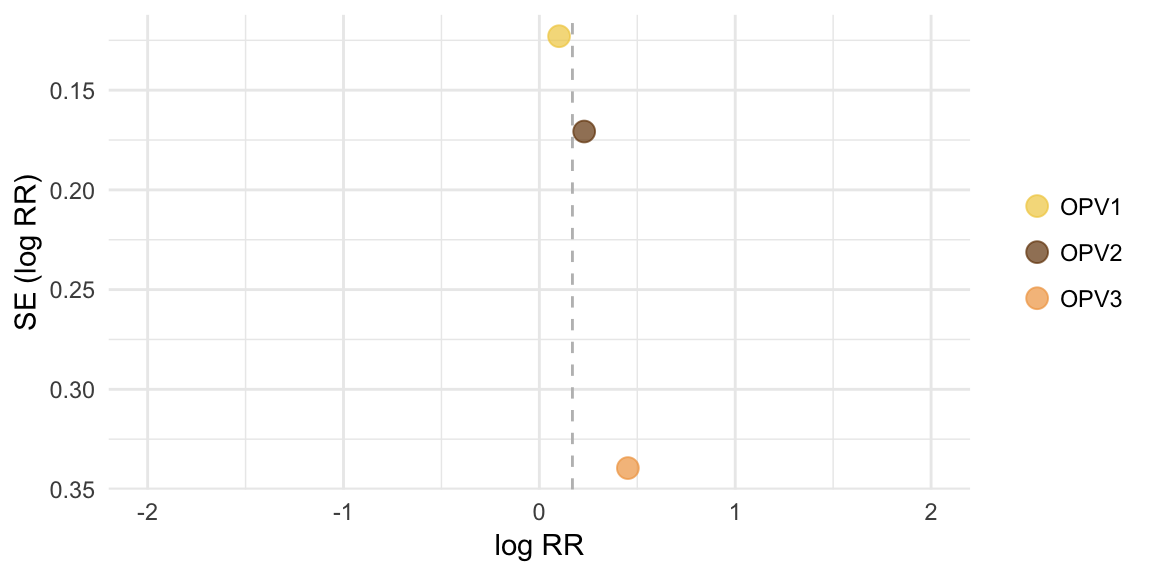
Egger’s test
Infants replicated across vaccines, therefore separate tests performed
## [1] "OPV1:"## [1] "Insufficient studies (n<3)"## [1] "OPV2:"## [1] "Insufficient studies (n<3)"## [1] "OPV3:"## [1] "Insufficient studies (n<3)"Meta-analysis output
##
## Multivariate Meta-Analysis Model (k = 3; method: REML)
##
##   logLik  Deviance       AIC       BIC      AICc
##   0.7455   -1.4909    0.5091   -0.7978    4.5091
##
## Variance Components:
##
##             estim    sqrt  nlvls  fixed     factor
## sigma^2    0.0000  0.0000      1    yes  Reference
##
## Test for Heterogeneity:
## Q(df = 2) = 1.1273, p-val = 0.5691
##
## Model Results:
##
## estimate      se    zval    pval    ci.lb   ci.ub
##   0.1688  0.0957  1.7639  0.0778  -0.0188  0.3564  .
##
## ---
## Signif. codes:  0 '***' 0.001 '**' 0.01 '*' 0.05 '.' 0.1 ' ' 1
Meta-regression output
##
## Multivariate Meta-Analysis Model (k = 3; method: REML)
##
## Variance Components:
##
##             estim    sqrt  nlvls  fixed     factor
## sigma^2    0.0000  0.0000      1    yes  Reference
##
## Test for Residual Heterogeneity:
## QE(df = 0) = 0.0000, p-val = 1.0000
##
## Test of Moderators (coefficient(s) 2:3):
## QM(df = 2) = 1.1273, p-val = 0.5691
##
## Model Results:
##
##                         estimate      se    zval    pval    ci.lb   ci.ub
## intrcpt                   0.1006  0.1229  0.8182  0.4132  -0.1404  0.3415
## Measure_of_SCOPV2 N-AB    0.1283  0.2104  0.6096  0.5421  -0.2841  0.5406
## Measure_of_SCOPV3 N-AB    0.3514  0.3611  0.9732  0.3305  -0.3563  1.0591
##
## intrcpt
## Measure_of_SCOPV2 N-AB
## Measure_of_SCOPV3 N-AB
##
## ---
## Signif. codes:  0 '***' 0.001 '**' 0.01 '*' 0.05 '.' 0.1 ' ' 1
Serotype-specific outputs
Summary of PV1 studies
## [1] "Insufficient studies (n<2)"Summary of PV2 studies
## [1] "Insufficient studies (n<2)"Summary of PV3 studies
## [1] "Insufficient studies (n<2)"