Vitamin A
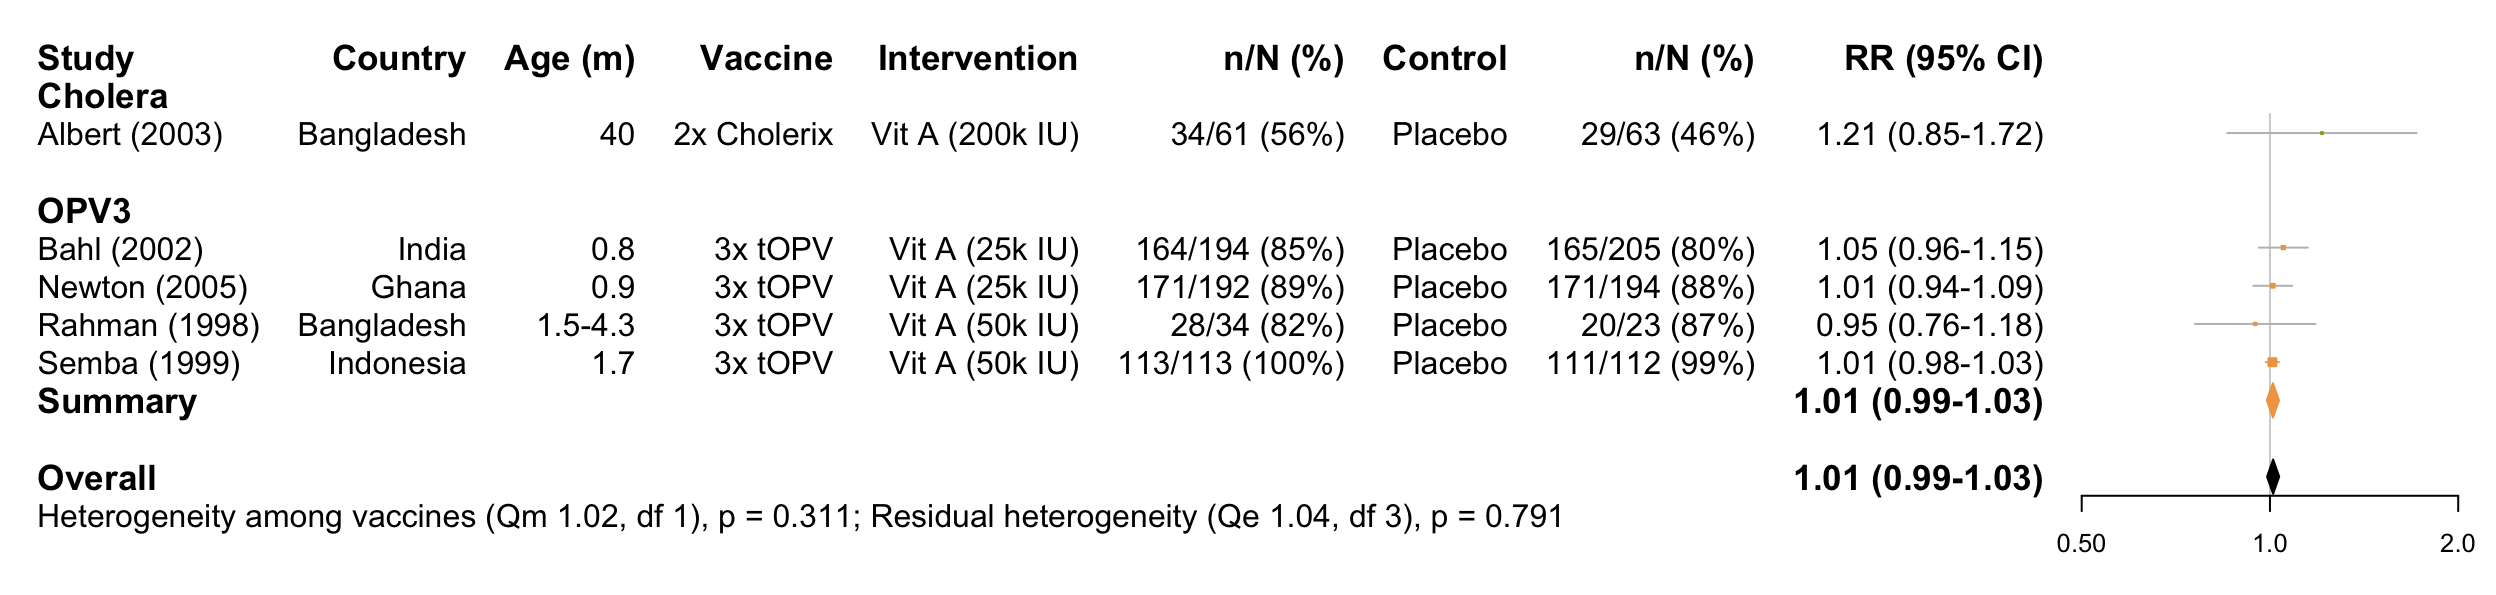
Full analysis
Forest plot
Funnel plot
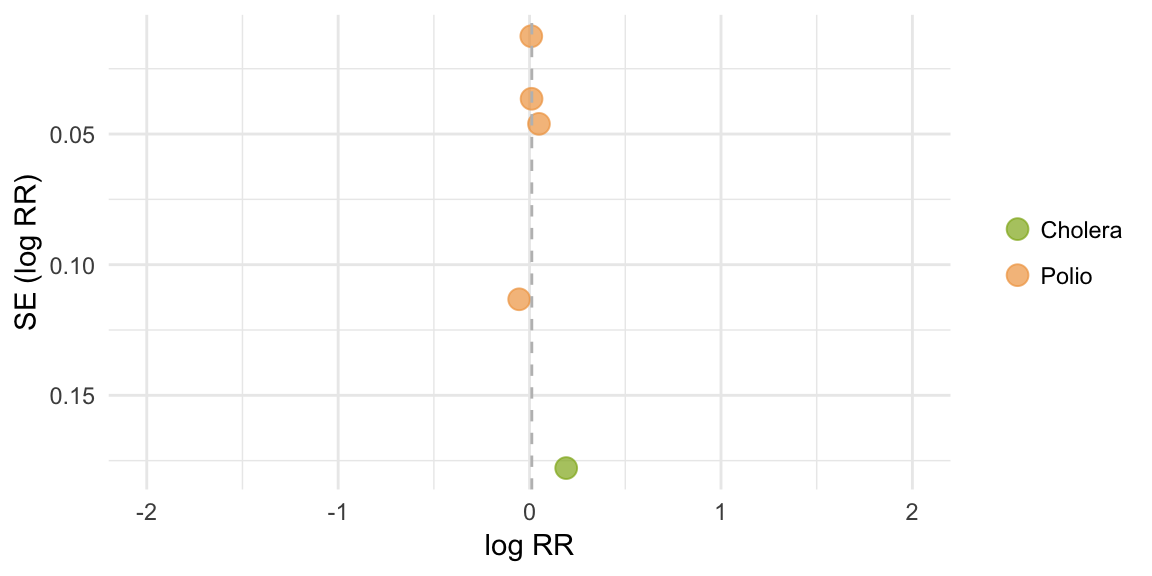
Egger’s test
## [1] "No replication of infants across vaccines or significant vaccine effect, therefore combined test performed"##
## Regression Test for Funnel Plot Asymmetry
##
## model: mixed-effects meta-regression model
## predictor: standard error
##
## test for funnel plot asymmetry: z = 0.6462, p = 0.5181Meta-analysis output
##
## Random-Effects Model (k = 5; tau^2 estimator: REML)
##
##   logLik  deviance       AIC       BIC      AICc
##   6.2926  -12.5851   -8.5851   -9.8126    3.4149
##
## tau^2 (estimated amount of total heterogeneity): 0 (SE = 0.0008)
## tau (square root of estimated tau^2 value):      0
## I^2 (total heterogeneity / total variability):   0.00%
## H^2 (total variability / sampling variability):  1.00
##
## Test for Heterogeneity:
## Q(df = 4) = 2.0666, p-val = 0.7235
##
## Model Results:
##
## estimate      se    zval    pval    ci.lb   ci.ub
##   0.0117  0.0114  1.0223  0.3067  -0.0107  0.0340
##
## ---
## Signif. codes:  0 '***' 0.001 '**' 0.01 '*' 0.05 '.' 0.1 ' ' 1
Meta-regression output
##
## Mixed-Effects Model (k = 5; tau^2 estimator: REML)
##
## tau^2 (estimated amount of residual heterogeneity):     0 (SE = 0.0008)
## tau (square root of estimated tau^2 value):             0
## I^2 (residual heterogeneity / unaccounted variability): 0.00%
## H^2 (unaccounted variability / sampling variability):   1.00
## R^2 (amount of heterogeneity accounted for):            NA%
##
## Test for Residual Heterogeneity:
## QE(df = 3) = 1.0419, p-val = 0.7911
##
## Test of Moderators (coefficient(s) 2):
## QM(df = 1) = 1.0247, p-val = 0.3114
##
## Model Results:
##
##               estimate      se     zval    pval    ci.lb   ci.ub
## intrcpt         0.1913  0.1778   1.0758  0.2820  -0.1572  0.5399
## VaccinePolio   -0.1804  0.1782  -1.0123  0.3114  -0.5297  0.1689
##
## ---
## Signif. codes:  0 '***' 0.001 '**' 0.01 '*' 0.05 '.' 0.1 ' ' 1
Intervention-specific outputs
Summary of cholera studies
## [1] "Insufficient studies (n<2)"Summary of rotavirus studies
## [1] "Insufficient studies (n<2)"Summary of PV3 studies
##
## Random-Effects Model (k = 4; tau^2 estimator: REML)
##
##   logLik  deviance       AIC       BIC      AICc
##   5.8875  -11.7750   -7.7750   -9.5778    4.2250
##
## tau^2 (estimated amount of total heterogeneity): 0 (SE = 0.0008)
## tau (square root of estimated tau^2 value):      0
## I^2 (total heterogeneity / total variability):   0.00%
## H^2 (total variability / sampling variability):  1.00
##
## Test for Heterogeneity:
## Q(df = 3) = 1.0419, p-val = 0.7911
##
## Model Results:
##
## estimate      se    zval    pval    ci.lb   ci.ub
##   0.0109  0.0114  0.9552  0.3395  -0.0115  0.0334
##
## ---
## Signif. codes:  0 '***' 0.001 '**' 0.01 '*' 0.05 '.' 0.1 ' ' 1
Meta-regression: secondary moderators
Age group
## [1] "Residual heterogeneity not significant (p>0.05)"Income setting
## [1] "Residual heterogeneity not significant (p>0.05)"Background immunogenicity (seroconversion rate in the control group)
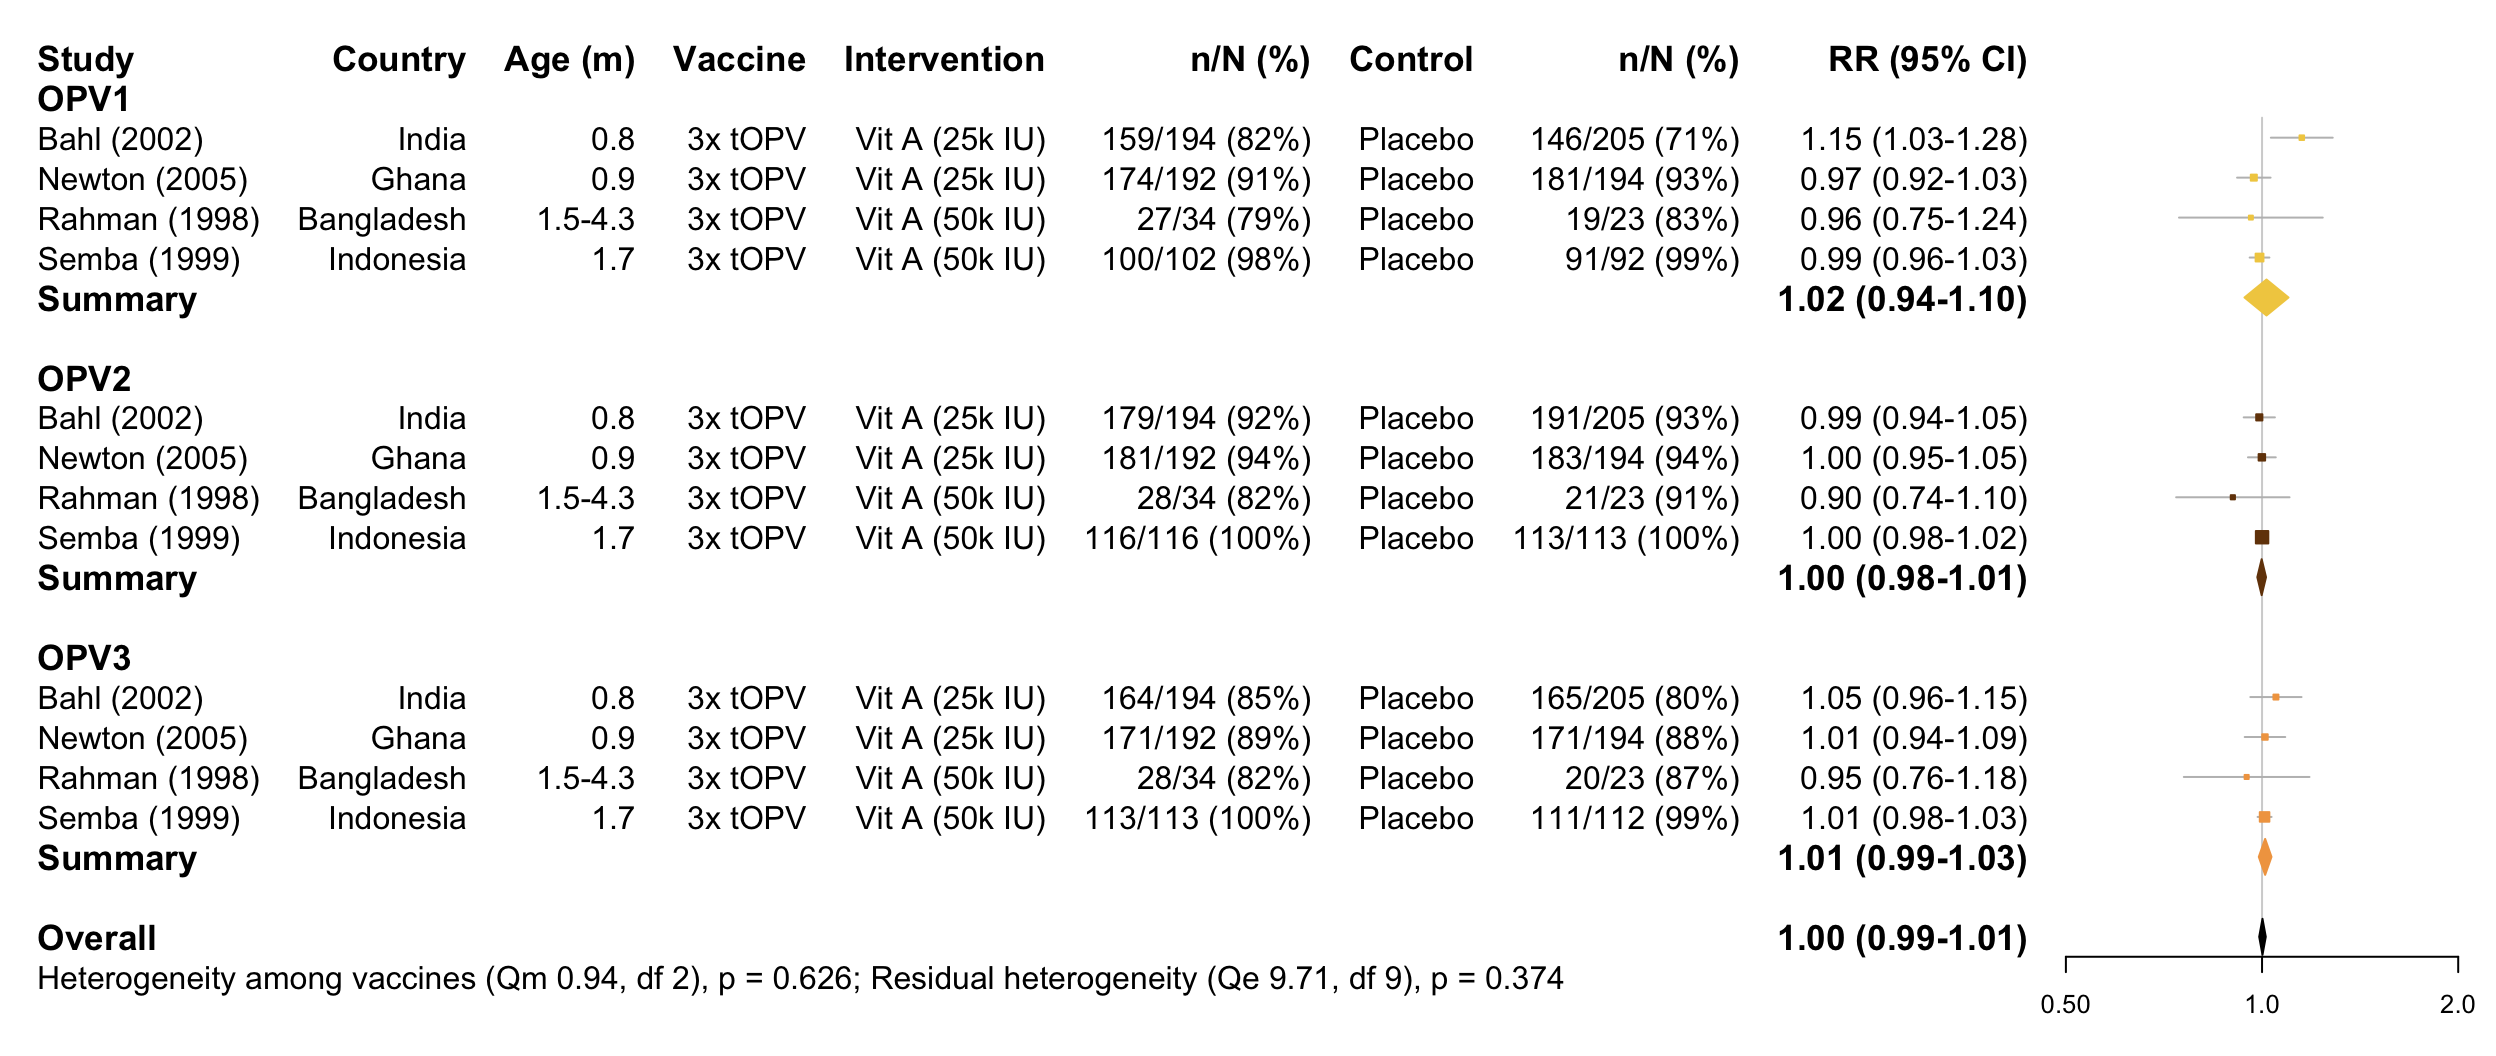
## [1] "Residual heterogeneity not significant (p>0.05)"OPV-specific analysis
Forest plot
Funnel plot
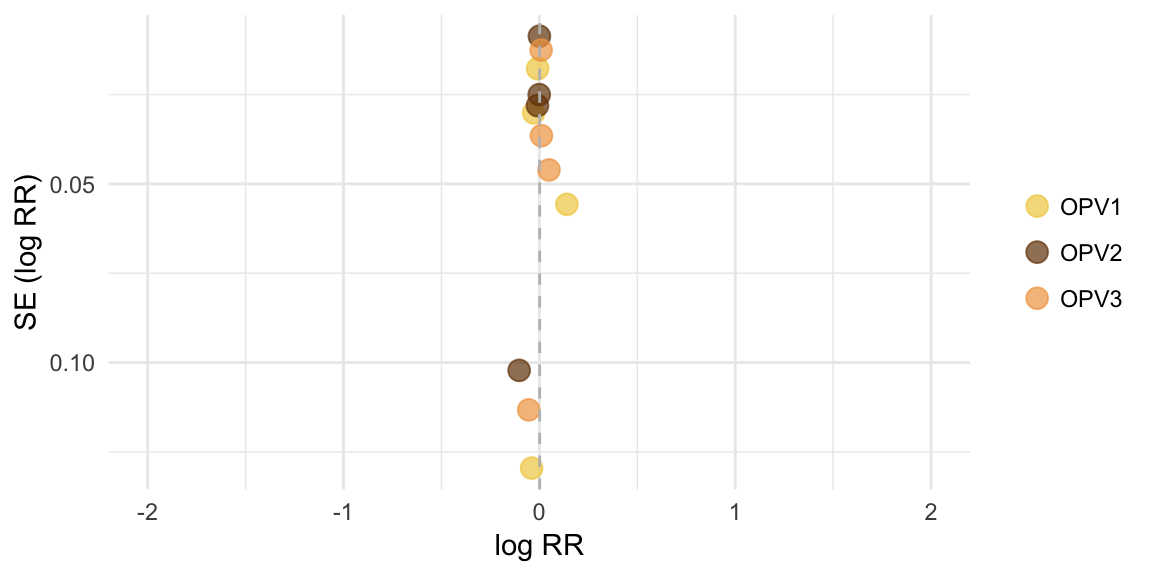
Egger’s test
Infants replicated across vaccines, therefore separate tests performed
## [1] "OPV1:"##
## Regression Test for Funnel Plot Asymmetry
##
## model: mixed-effects meta-regression model
## predictor: standard error
##
## test for funnel plot asymmetry: z = 0.2728, p = 0.7850## [1] "OPV2:"##
## Regression Test for Funnel Plot Asymmetry
##
## model: mixed-effects meta-regression model
## predictor: standard error
##
## test for funnel plot asymmetry: z = -0.8915, p = 0.3727## [1] "OPV3:"##
## Regression Test for Funnel Plot Asymmetry
##
## model: mixed-effects meta-regression model
## predictor: standard error
##
## test for funnel plot asymmetry: z = 0.0640, p = 0.9490Meta-analysis output
##
## Multivariate Meta-Analysis Model (k = 12; method: REML)
##
##   logLik  Deviance       AIC       BIC      AICc
##  20.3740  -40.7480  -36.7480  -35.9522  -35.2480
##
## Variance Components:
##
##             estim    sqrt  nlvls  fixed     factor
## sigma^2    0.0000  0.0000      4     no  Reference
##
## Test for Heterogeneity:
## Q(df = 11) = 10.6488, p-val = 0.4731
##
## Model Results:
##
## estimate      se    zval    pval    ci.lb   ci.ub
##   0.0016  0.0059  0.2637  0.7920  -0.0100  0.0132
##
## ---
## Signif. codes:  0 '***' 0.001 '**' 0.01 '*' 0.05 '.' 0.1 ' ' 1
Meta-regression output
##
## Multivariate Meta-Analysis Model (k = 12; method: REML)
##
## Variance Components:
##
##             estim    sqrt  nlvls  fixed     factor
## sigma^2    0.0000  0.0000      4     no  Reference
##
## Test for Residual Heterogeneity:
## QE(df = 9) = 9.7130, p-val = 0.3742
##
## Test of Moderators (coefficient(s) 2:3):
## QM(df = 2) = 0.9358, p-val = 0.6263
##
## Model Results:
##
##                         estimate      se     zval    pval    ci.lb   ci.ub
## intrcpt                  -0.0037  0.0147  -0.2529  0.8004  -0.0324  0.0250
## Measure_of_SCOPV2 N-AB    0.0024  0.0166   0.1425  0.8867  -0.0302  0.0350
## Measure_of_SCOPV3 N-AB    0.0146  0.0186   0.7869  0.4313  -0.0218  0.0511
##
## intrcpt
## Measure_of_SCOPV2 N-AB
## Measure_of_SCOPV3 N-AB
##
## ---
## Signif. codes:  0 '***' 0.001 '**' 0.01 '*' 0.05 '.' 0.1 ' ' 1
Serotype-specific outputs
Summary of PV1 studies
##
## Random-Effects Model (k = 4; tau^2 estimator: REML)
##
##   logLik  deviance       AIC       BIC      AICc
##   3.0671   -6.1343   -2.1343   -3.9370    9.8657
##
## tau^2 (estimated amount of total heterogeneity): 0.0039 (SE = 0.0050)
## tau (square root of estimated tau^2 value):      0.0625
## I^2 (total heterogeneity / total variability):   74.21%
## H^2 (total variability / sampling variability):  3.88
##
## Test for Heterogeneity:
## Q(df = 3) = 7.5597, p-val = 0.0560
##
## Model Results:
##
## estimate      se    zval    pval    ci.lb   ci.ub
##   0.0157  0.0397  0.3959  0.6922  -0.0621  0.0935
##
## ---
## Signif. codes:  0 '***' 0.001 '**' 0.01 '*' 0.05 '.' 0.1 ' ' 1
Summary of PV2 studies
##
## Random-Effects Model (k = 4; tau^2 estimator: REML)
##
##   logLik  deviance       AIC       BIC      AICc
##   6.8208  -13.6416   -9.6416  -11.4444    2.3584
##
## tau^2 (estimated amount of total heterogeneity): 0 (SE = 0.0004)
## tau (square root of estimated tau^2 value):      0
## I^2 (total heterogeneity / total variability):   0.00%
## H^2 (total variability / sampling variability):  1.00
##
## Test for Heterogeneity:
## Q(df = 3) = 1.1113, p-val = 0.7743
##
## Model Results:
##
## estimate      se     zval    pval    ci.lb   ci.ub
##  -0.0013  0.0078  -0.1704  0.8647  -0.0167  0.0140
##
## ---
## Signif. codes:  0 '***' 0.001 '**' 0.01 '*' 0.05 '.' 0.1 ' ' 1
Summary of PV3 studies
##
## Random-Effects Model (k = 4; tau^2 estimator: REML)
##
##   logLik  deviance       AIC       BIC      AICc
##   5.8875  -11.7750   -7.7750   -9.5778    4.2250
##
## tau^2 (estimated amount of total heterogeneity): 0 (SE = 0.0008)
## tau (square root of estimated tau^2 value):      0
## I^2 (total heterogeneity / total variability):   0.00%
## H^2 (total variability / sampling variability):  1.00
##
## Test for Heterogeneity:
## Q(df = 3) = 1.0419, p-val = 0.7911
##
## Model Results:
##
## estimate      se    zval    pval    ci.lb   ci.ub
##   0.0109  0.0114  0.9552  0.3395  -0.0115  0.0334
##
## ---
## Signif. codes:  0 '***' 0.001 '**' 0.01 '*' 0.05 '.' 0.1 ' ' 1