Zinc
Full analysis
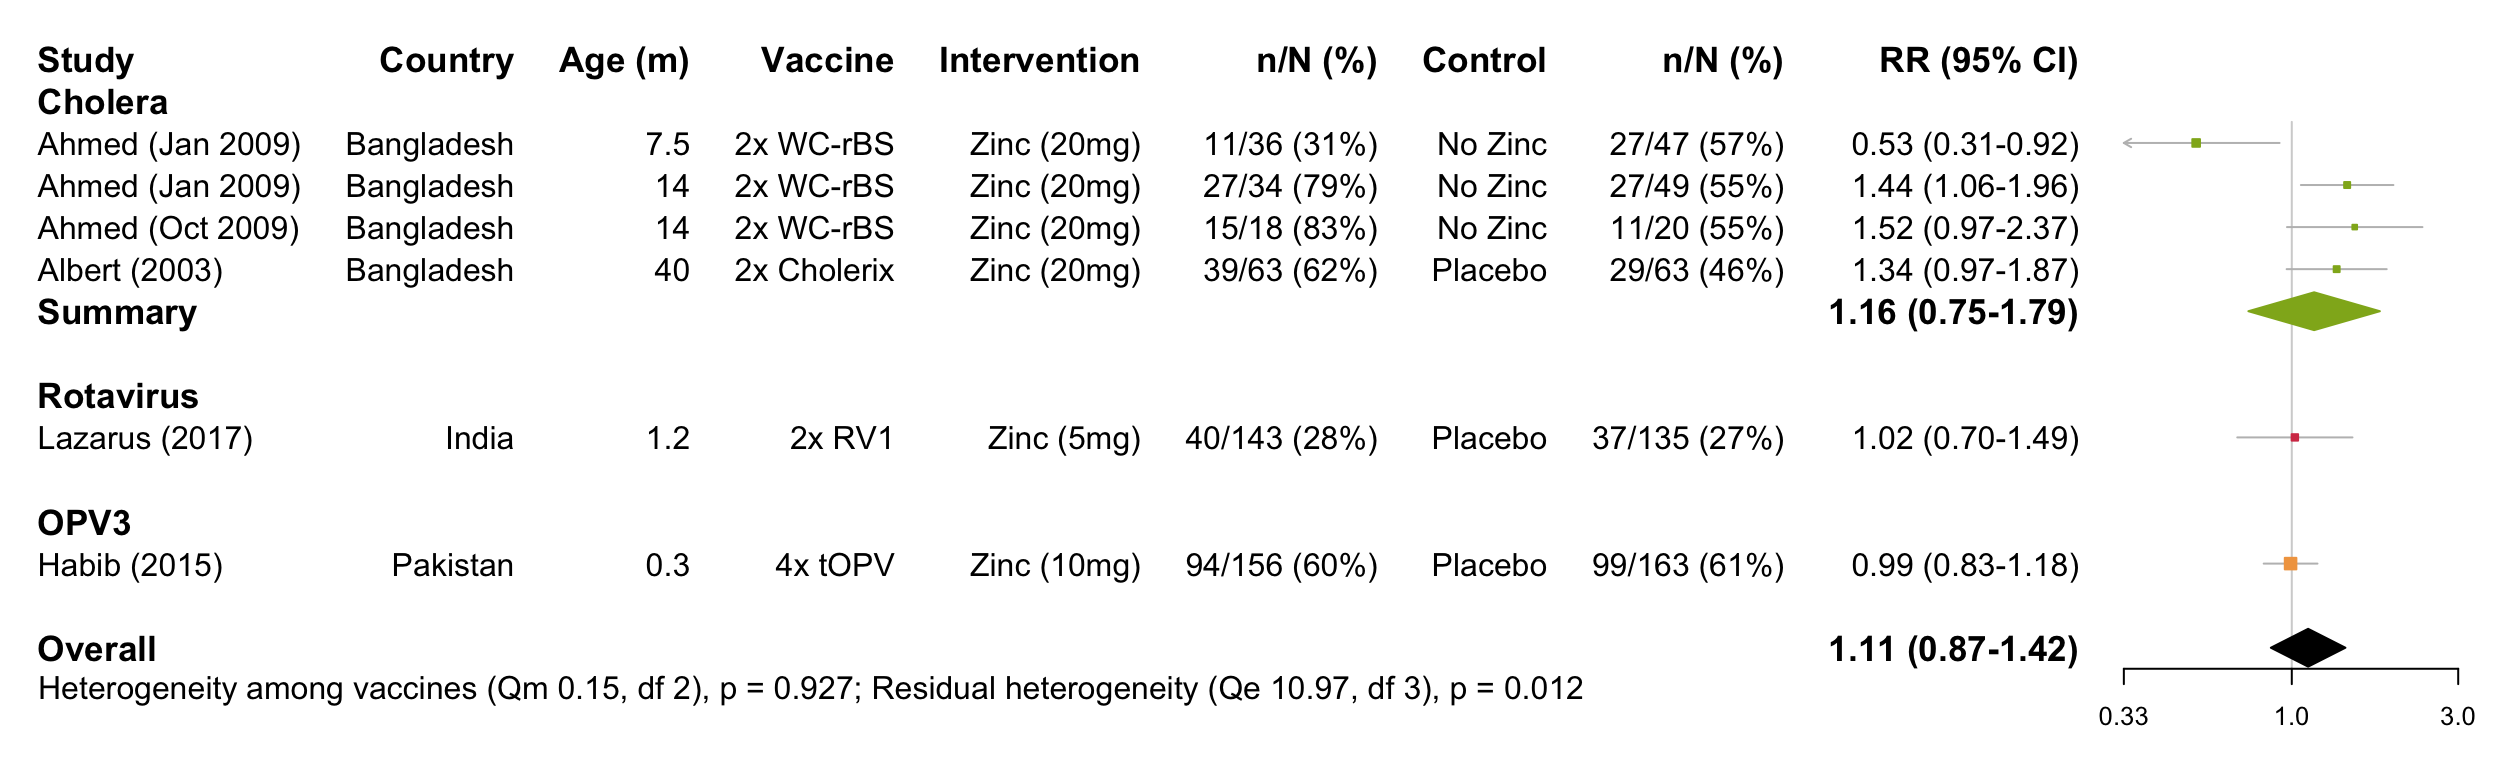
Forest plot
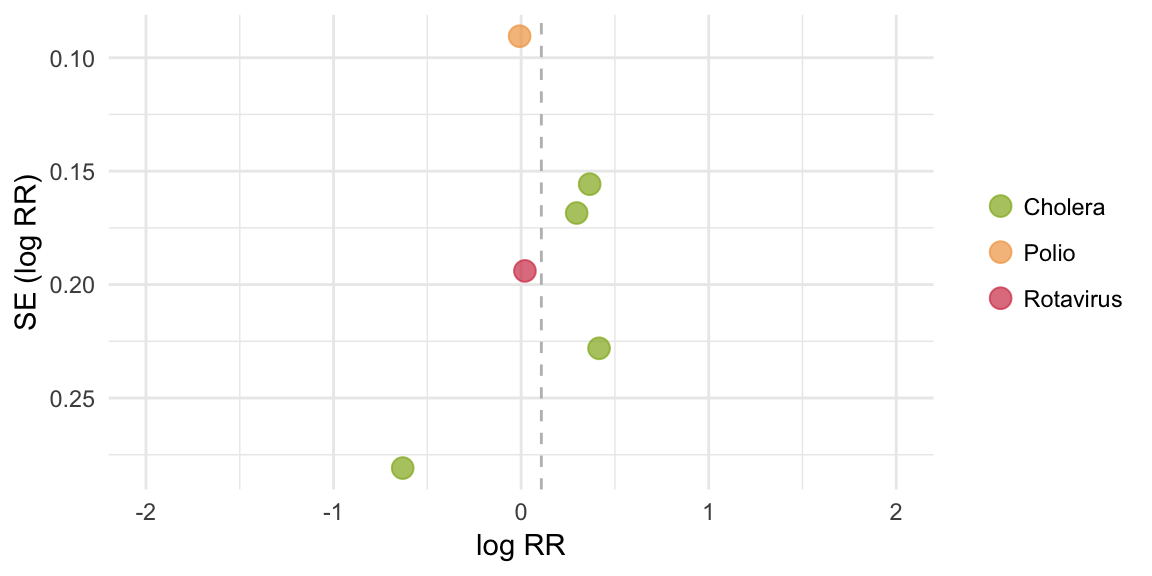
Funnel plot
Egger’s test
## [1] "No replication of infants across vaccines or significant vaccine effect, therefore combined test performed"##
## Regression Test for Funnel Plot Asymmetry
##
## model: mixed-effects meta-regression model
## predictor: standard error
##
## test for funnel plot asymmetry: z = -0.7740, p = 0.4389Meta-analysis output
##
## Random-Effects Model (k = 6; tau^2 estimator: REML)
##
##   logLik  deviance       AIC       BIC      AICc
##  -1.8637    3.7275    7.7275    6.9463   13.7275
##
## tau^2 (estimated amount of total heterogeneity): 0.0612 (SE = 0.0593)
## tau (square root of estimated tau^2 value):      0.2473
## I^2 (total heterogeneity / total variability):   69.10%
## H^2 (total variability / sampling variability):  3.24
##
## Test for Heterogeneity:
## Q(df = 5) = 14.5442, p-val = 0.0125
##
## Model Results:
##
## estimate      se    zval    pval    ci.lb   ci.ub
##   0.1079  0.1256  0.8594  0.3901  -0.1382  0.3541
##
## ---
## Signif. codes:  0 '***' 0.001 '**' 0.01 '*' 0.05 '.' 0.1 ' ' 1
Meta-regression output
##
## Mixed-Effects Model (k = 6; tau^2 estimator: REML)
##
## tau^2 (estimated amount of residual heterogeneity):     0.1525 (SE = 0.1601)
## tau (square root of estimated tau^2 value):             0.3905
## I^2 (residual heterogeneity / unaccounted variability): 79.51%
## H^2 (unaccounted variability / sampling variability):   4.88
## R^2 (amount of heterogeneity accounted for):            0.00%
##
## Test for Residual Heterogeneity:
## QE(df = 3) = 10.9734, p-val = 0.0119
##
## Test of Moderators (coefficient(s) 2:3):
## QM(df = 2) = 0.1514, p-val = 0.9271
##
## Model Results:
##
##                   estimate      se     zval    pval    ci.lb   ci.ub
## intrcpt             0.1475  0.2214   0.6662  0.5053  -0.2865  0.5815
## VaccinePolio       -0.1554  0.4580  -0.3394  0.7343  -1.0531  0.7422
## VaccineRotavirus   -0.1271  0.4891  -0.2599  0.7949  -1.0856  0.8314
##
## ---
## Signif. codes:  0 '***' 0.001 '**' 0.01 '*' 0.05 '.' 0.1 ' ' 1
Intervention-specific outputs
Summary of cholera studies
##
## Random-Effects Model (k = 4; tau^2 estimator: REML)
##
##   logLik  deviance       AIC       BIC      AICc
##  -2.0064    4.0127    8.0127    6.2100   20.0127
##
## tau^2 (estimated amount of total heterogeneity): 0.1525 (SE = 0.1601)
## tau (square root of estimated tau^2 value):      0.3905
## I^2 (total heterogeneity / total variability):   79.51%
## H^2 (total variability / sampling variability):  4.88
##
## Test for Heterogeneity:
## Q(df = 3) = 10.9734, p-val = 0.0119
##
## Model Results:
##
## estimate      se    zval    pval    ci.lb   ci.ub
##   0.1475  0.2214  0.6662  0.5053  -0.2865  0.5815
##
## ---
## Signif. codes:  0 '***' 0.001 '**' 0.01 '*' 0.05 '.' 0.1 ' ' 1
Summary of rotavirus studies
## [1] "Insufficient studies (n<2)"Summary of PV3 studies
## [1] "Insufficient studies (n<2)"Meta-regression: secondary moderators
Age group
##
## child_under5y        infant
##             3             3
##
## Mixed-Effects Model (k = 6; tau^2 estimator: REML)
##
## tau^2 (estimated amount of residual heterogeneity): 0.0000 (SE = 0.0211)
## tau (square root of estimated tau^2 value): 0.0026
## I^2 (residual heterogeneity / unaccounted variability): 0.02%
## H^2 (unaccounted variability / sampling variability): 1.00
## R^2 (amount of heterogeneity accounted for): 99.99%
##
## Test for Residual Heterogeneity:
## QE(df = 4) = 4.8244, p-val = 0.3058
##
## Test of Moderators (coefficient(s) 2):
## QM(df = 1) = 9.7173, p-val = 0.0018
##
## Model Results:
##
## estimate se zval pval ci.lb
## intrcpt 0.3500 0.1022 3.4237 0.0006 0.1497
## factor(Age_group)infant -0.4023 0.1291 -3.1173 0.0018 -0.6553
## ci.ub
## intrcpt 0.5504 ***
## factor(Age_group)infant -0.1494 **
##
## ---
## Signif. codes: 0 '***' 0.001 '**' 0.01 '*' 0.05 '.' 0.1 ' ' 1Income setting
## [1] "No variation in moderator among studies"Background immunogenicity (seroconversion rate in the control group)
##
## Mixed-Effects Model (k = 6; tau^2 estimator: REML)
##
## tau^2 (estimated amount of residual heterogeneity):     0.0986 (SE = 0.0945)
## tau (square root of estimated tau^2 value):             0.3140
## I^2 (residual heterogeneity / unaccounted variability): 76.87%
## H^2 (unaccounted variability / sampling variability):   4.32
## R^2 (amount of heterogeneity accounted for):            0.00%
##
## Test for Residual Heterogeneity:
## QE(df = 4) = 14.1815, p-val = 0.0067
##
## Test of Moderators (coefficient(s) 2):
## QM(df = 1) = 0.0270, p-val = 0.8695
##
## Model Results:
##
##                                      estimate      se     zval    pval
## intrcpt                                0.2700  1.0339   0.2612  0.7940
## asin(sqrt(Baseline_seroconversion))   -0.2131  1.2972  -0.1643  0.8695
##                                        ci.lb   ci.ub
## intrcpt                              -1.7565  2.2965
## asin(sqrt(Baseline_seroconversion))  -2.7556  2.3293
##
## ---
## Signif. codes:  0 '***' 0.001 '**' 0.01 '*' 0.05 '.' 0.1 ' ' 1
OPV-specific analysis
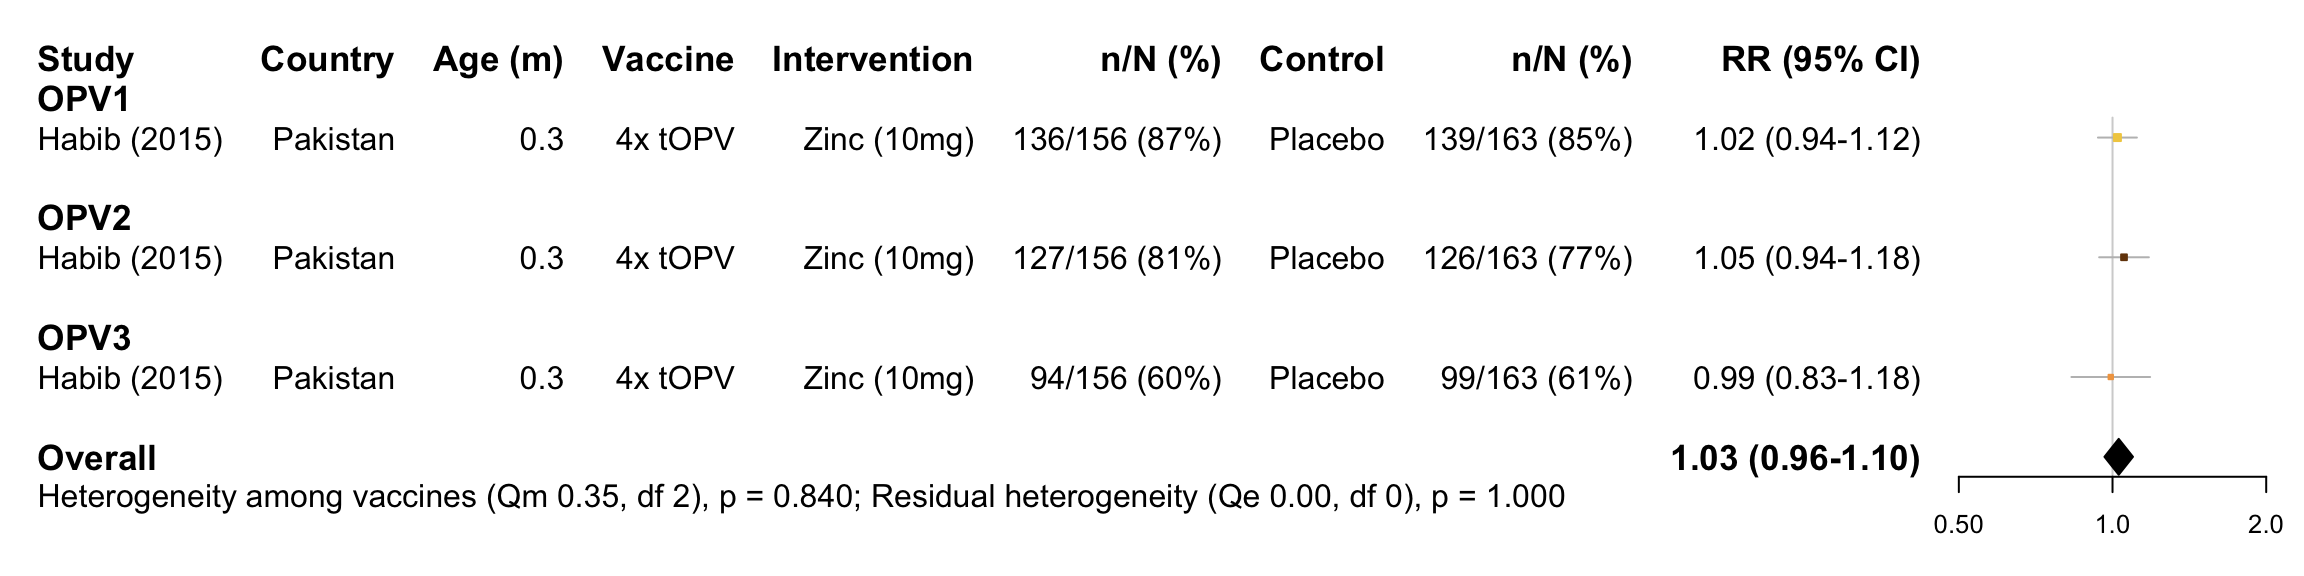
Forest plot
Funnel plot
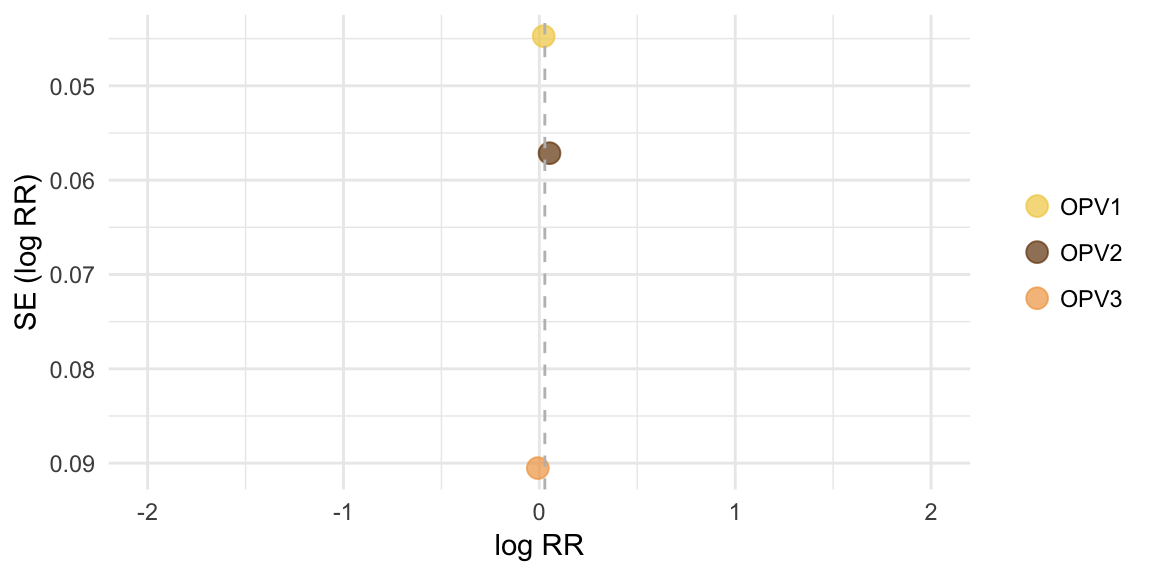
Egger’s test
Infants replicated across vaccines, therefore separate tests performed
## [1] "OPV1:"## [1] "Insufficient studies (n<3)"## [1] "OPV2:"## [1] "Insufficient studies (n<3)"## [1] "OPV3:"## [1] "Insufficient studies (n<3)"Meta-analysis output
##
## Multivariate Meta-Analysis Model (k = 3; method: REML)
##
##   logLik  Deviance       AIC       BIC      AICc
##   3.4919   -6.9839   -4.9839   -6.2907   -0.9839
##
## Variance Components:
##
##             estim    sqrt  nlvls  fixed     factor
## sigma^2    0.0000  0.0000      1    yes  Reference
##
## Test for Heterogeneity:
## Q(df = 2) = 0.3486, p-val = 0.8401
##
## Model Results:
##
## estimate      se    zval    pval    ci.lb   ci.ub
##   0.0279  0.0328  0.8510  0.3947  -0.0364  0.0923
##
## ---
## Signif. codes:  0 '***' 0.001 '**' 0.01 '*' 0.05 '.' 0.1 ' ' 1
Meta-regression output
##
## Multivariate Meta-Analysis Model (k = 3; method: REML)
##
## Variance Components:
##
##             estim    sqrt  nlvls  fixed     factor
## sigma^2    0.0000  0.0000      1    yes  Reference
##
## Test for Residual Heterogeneity:
## QE(df = 0) = 0.0000, p-val = 1.0000
##
## Test of Moderators (coefficient(s) 2:3):
## QM(df = 2) = 0.3486, p-val = 0.8401
##
## Model Results:
##
##                         estimate      se     zval    pval    ci.lb   ci.ub
## intrcpt                   0.0221  0.0447   0.4934  0.6217  -0.0656  0.1098
## Measure_of_SCOPV2 N-AB    0.0297  0.0726   0.4096  0.6821  -0.1125  0.1720
## Measure_of_SCOPV3 N-AB   -0.0300  0.1010  -0.2972  0.7663  -0.2279  0.1679
##
## intrcpt
## Measure_of_SCOPV2 N-AB
## Measure_of_SCOPV3 N-AB
##
## ---
## Signif. codes:  0 '***' 0.001 '**' 0.01 '*' 0.05 '.' 0.1 ' ' 1
Serotype-specific outputs
Summary of PV1 studies
## [1] "Insufficient studies (n<2)"Summary of PV2 studies
## [1] "Insufficient studies (n<2)"Summary of PV3 studies
## [1] "Insufficient studies (n<2)"