Buffer
Full analysis
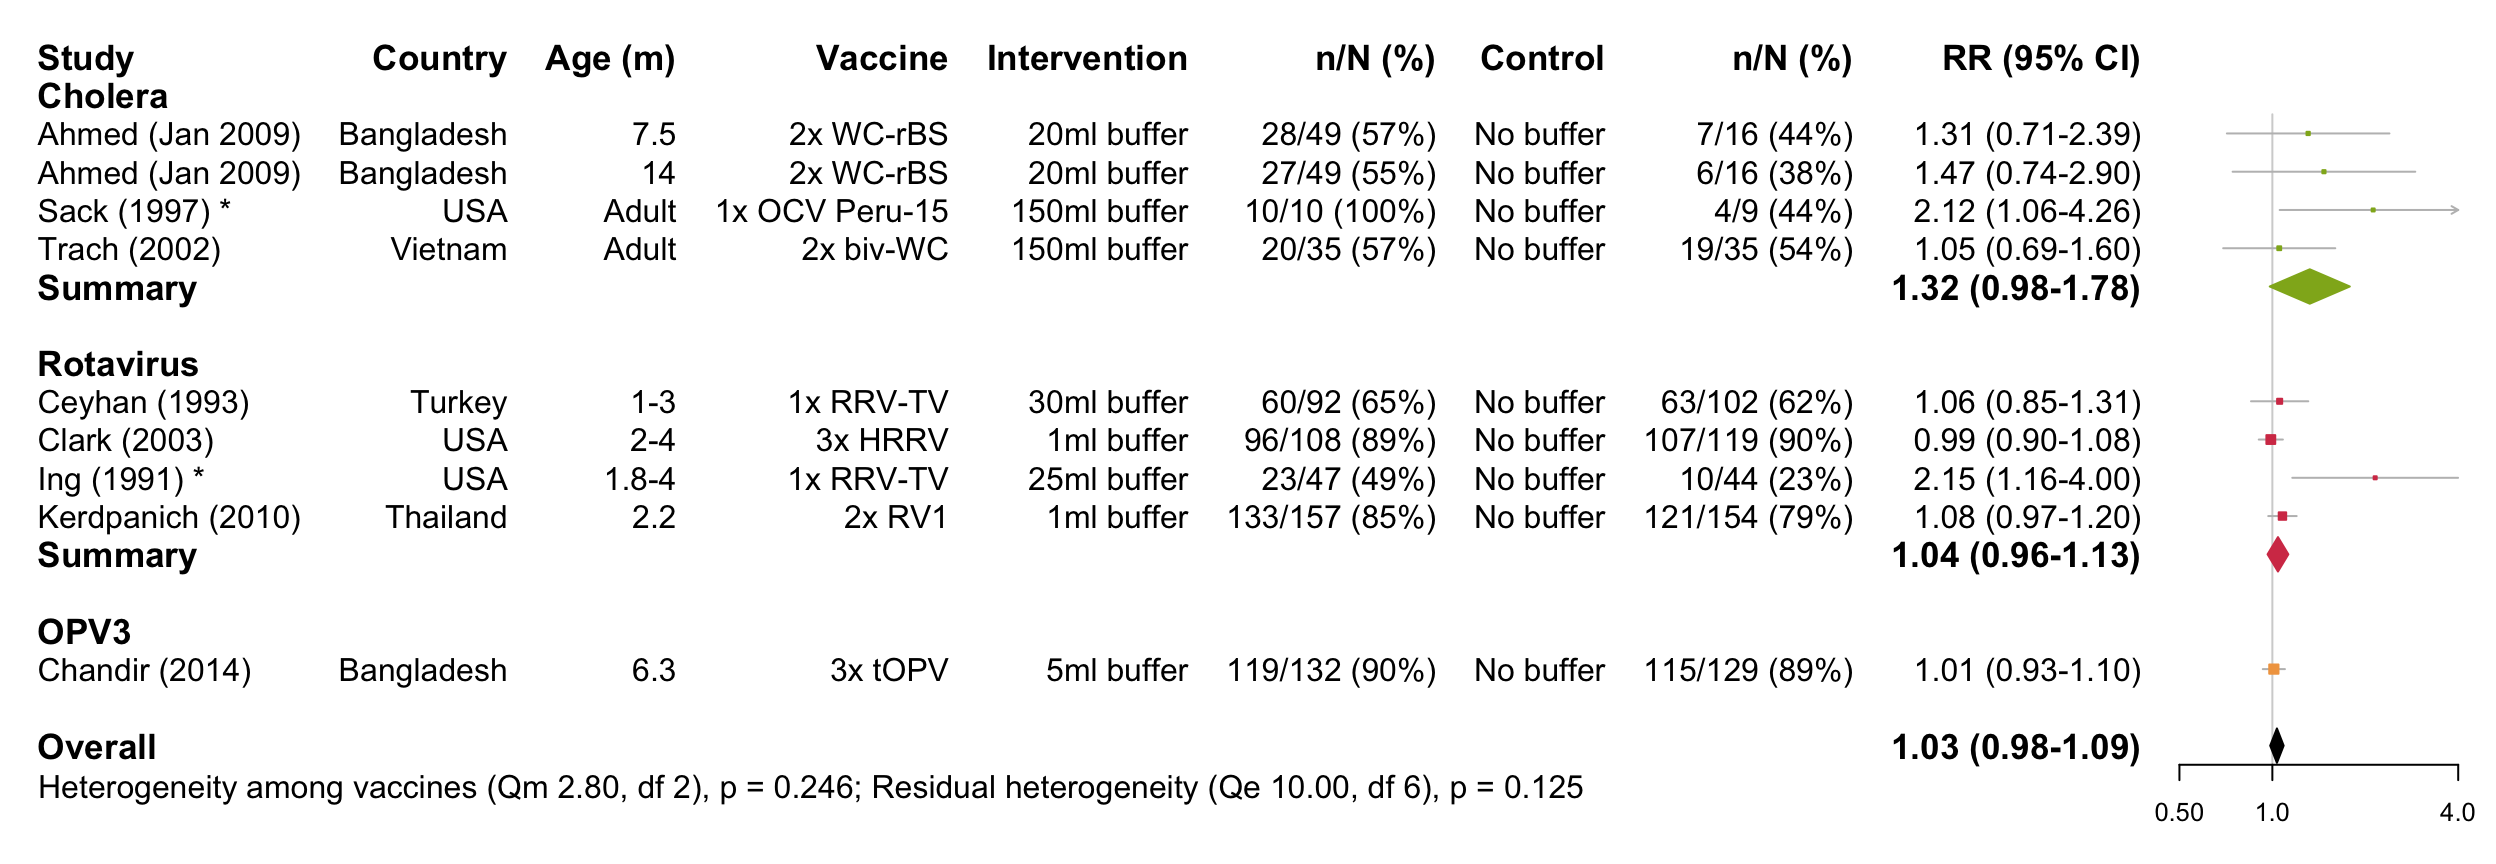
Forest plot
Funnel plot
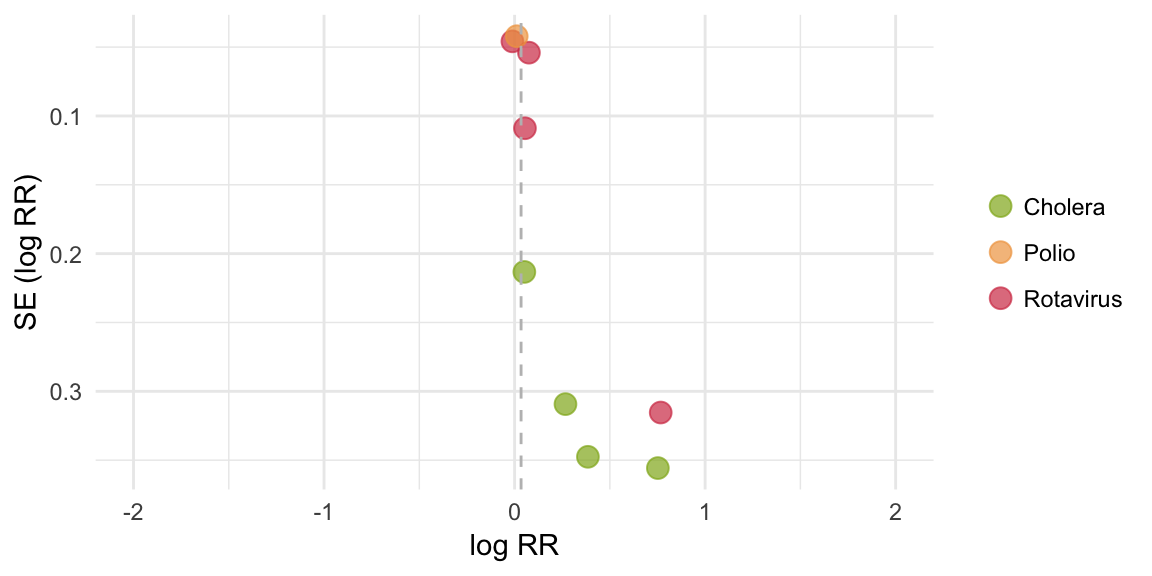
Egger’s test
## [1] "No replication of infants across vaccines or significant vaccine effect, therefore combined test performed"##
## Regression Test for Funnel Plot Asymmetry
##
## model: mixed-effects meta-regression model
## predictor: standard error
##
## test for funnel plot asymmetry: z = 2.9155, p = 0.0036Meta-analysis output
##
## Random-Effects Model (k = 9; tau^2 estimator: REML)
##
##   logLik  deviance       AIC       BIC      AICc
##   0.9485   -1.8970    2.1030    2.2619    4.5030
##
## tau^2 (estimated amount of total heterogeneity): 0.0000 (SE = 0.0022)
## tau (square root of estimated tau^2 value):      0.0011
## I^2 (total heterogeneity / total variability):   0.02%
## H^2 (total variability / sampling variability):  1.00
##
## Test for Heterogeneity:
## Q(df = 8) = 12.9644, p-val = 0.1131
##
## Model Results:
##
## estimate      se    zval    pval    ci.lb   ci.ub
##   0.0341  0.0256  1.3303  0.1834  -0.0161  0.0842
##
## ---
## Signif. codes:  0 '***' 0.001 '**' 0.01 '*' 0.05 '.' 0.1 ' ' 1
Meta-regression output
##
## Mixed-Effects Model (k = 9; tau^2 estimator: REML)
##
## tau^2 (estimated amount of residual heterogeneity):     0.0012 (SE = 0.0049)
## tau (square root of estimated tau^2 value):             0.0347
## I^2 (residual heterogeneity / unaccounted variability): 10.13%
## H^2 (unaccounted variability / sampling variability):   1.11
## R^2 (amount of heterogeneity accounted for):            0.00%
##
## Test for Residual Heterogeneity:
## QE(df = 6) = 9.9979, p-val = 0.1247
##
## Test of Moderators (coefficient(s) 2:3):
## QM(df = 2) = 2.8015, p-val = 0.2464
##
## Model Results:
##
##                   estimate      se     zval    pval    ci.lb   ci.ub
## intrcpt             0.2700  0.1447   1.8660  0.0620  -0.0136  0.5536  .
## VaccinePolio       -0.2588  0.1546  -1.6736  0.0942  -0.5619  0.0443  .
## VaccineRotavirus   -0.2280  0.1501  -1.5191  0.1287  -0.5221  0.0662
##
## ---
## Signif. codes:  0 '***' 0.001 '**' 0.01 '*' 0.05 '.' 0.1 ' ' 1
Intervention-specific outputs
Summary of cholera studies
##
## Random-Effects Model (k = 4; tau^2 estimator: REML)
##
##   logLik  deviance       AIC       BIC      AICc
##  -0.6855    1.3710    5.3710    3.5682   17.3710
##
## tau^2 (estimated amount of total heterogeneity): 0.0089 (SE = 0.0774)
## tau (square root of estimated tau^2 value):      0.0943
## I^2 (total heterogeneity / total variability):   9.10%
## H^2 (total variability / sampling variability):  1.10
##
## Test for Heterogeneity:
## Q(df = 3) = 2.9964, p-val = 0.3922
##
## Model Results:
##
## estimate      se    zval    pval    ci.lb   ci.ub
##   0.2792  0.1524  1.8315  0.0670  -0.0196  0.5779  .
##
## ---
## Signif. codes:  0 '***' 0.001 '**' 0.01 '*' 0.05 '.' 0.1 ' ' 1
Summary of rotavirus studies
##
## Random-Effects Model (k = 4; tau^2 estimator: REML)
##
##   logLik  deviance       AIC       BIC      AICc
##   0.4476   -0.8951    3.1049    1.3021   15.1049
##
## tau^2 (estimated amount of total heterogeneity): 0.0012 (SE = 0.0048)
## tau (square root of estimated tau^2 value):      0.0340
## I^2 (total heterogeneity / total variability):   16.94%
## H^2 (total variability / sampling variability):  1.20
##
## Test for Heterogeneity:
## Q(df = 3) = 7.0015, p-val = 0.0719
##
## Model Results:
##
## estimate      se    zval    pval    ci.lb   ci.ub
##   0.0418  0.0396  1.0574  0.2903  -0.0357  0.1194
##
## ---
## Signif. codes:  0 '***' 0.001 '**' 0.01 '*' 0.05 '.' 0.1 ' ' 1
Summary of PV3 studies
## [1] "Insufficient studies (n<2)"Meta-regression: secondary moderators
Age group
## [1] "Residual heterogeneity not significant (p>0.05)"Income setting
## [1] "Residual heterogeneity not significant (p>0.05)"Background immunogenicity (seroconversion rate in the control group)
## [1] "Residual heterogeneity not significant (p>0.05)"OPV-specific analysis
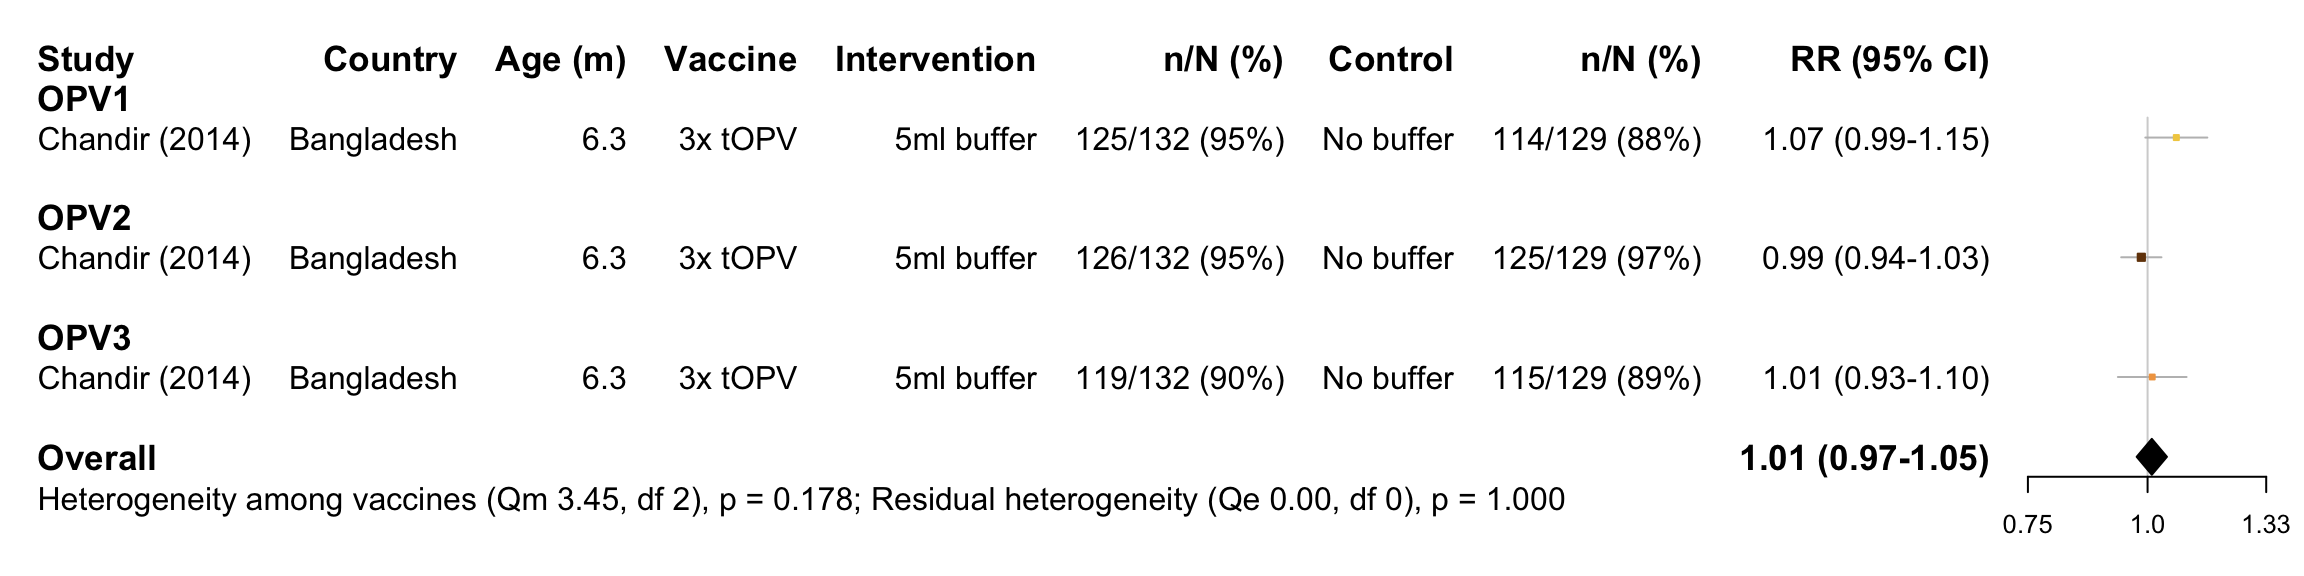
Forest plot
Funnel plot
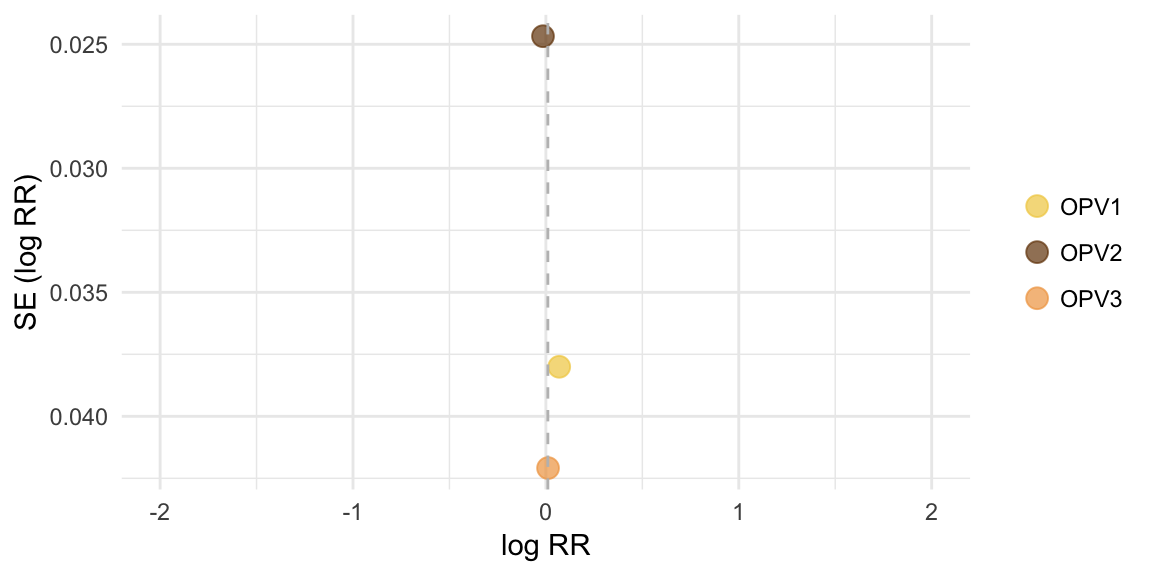
Egger’s test
Infants replicated across vaccines, therefore separate tests performed
## [1] "OPV1:"## [1] "Insufficient studies (n<3)"## [1] "OPV2:"## [1] "Insufficient studies (n<3)"## [1] "OPV3:"## [1] "Insufficient studies (n<3)"Meta-analysis output
##
## Multivariate Meta-Analysis Model (k = 3; method: REML)
##
##   logLik  Deviance       AIC       BIC      AICc
##   3.1406   -6.2811   -4.2811   -5.5880   -0.2811
##
## Variance Components:
##
##             estim    sqrt  nlvls  fixed     factor
## sigma^2    0.0000  0.0000      1    yes  Reference
##
## Test for Heterogeneity:
## Q(df = 2) = 3.4496, p-val = 0.1782
##
## Model Results:
##
## estimate      se    zval    pval    ci.lb   ci.ub
##   0.0102  0.0186  0.5481  0.5836  -0.0262  0.0466
##
## ---
## Signif. codes:  0 '***' 0.001 '**' 0.01 '*' 0.05 '.' 0.1 ' ' 1
Meta-regression output
##
## Multivariate Meta-Analysis Model (k = 3; method: REML)
##
## Variance Components:
##
##             estim    sqrt  nlvls  fixed     factor
## sigma^2    0.0000  0.0000      1    yes  Reference
##
## Test for Residual Heterogeneity:
## QE(df = 0) = 0.0000, p-val = 1.0000
##
## Test of Moderators (coefficient(s) 2:3):
## QM(df = 2) = 3.4496, p-val = 0.1782
##
## Model Results:
##
##                         estimate      se     zval    pval    ci.lb   ci.ub
## intrcpt                   0.0691  0.0380   1.8190  0.0689  -0.0054  0.1436
## Measure_of_SCOPV2 N-AB   -0.0841  0.0453  -1.8571  0.0633  -0.1730  0.0047
## Measure_of_SCOPV3 N-AB   -0.0579  0.0567  -1.0215  0.3070  -0.1691  0.0532
##
## intrcpt                 .
## Measure_of_SCOPV2 N-AB  .
## Measure_of_SCOPV3 N-AB
##
## ---
## Signif. codes:  0 '***' 0.001 '**' 0.01 '*' 0.05 '.' 0.1 ' ' 1
Serotype-specific outputs
Summary of PV1 studies
## [1] "Insufficient studies (n<2)"Summary of PV2 studies
## [1] "Insufficient studies (n<2)"Summary of PV3 studies
## [1] "Insufficient studies (n<2)"